The IELTS Writing Task 1 often presents data in various forms, requiring test-takers to showcase their analytical and reporting skills. One common theme is analyzing trends related to energy, and “solar power capacity by country” frequently appears in recent IELTS exams. This comprehensive guide aims to equip you with the knowledge and strategies needed to achieve a Band 7+ score on this topic.
We will delve into potential IELTS Writing Task 1 questions, analyze real data, craft a model answer, and provide valuable tips on grammar, vocabulary, and exam techniques specific to this theme.
Potential IELTS Writing Task 1 Questions
Based on the keyword “Solar Power Capacity by Country (2000-2023),” here are some potential IELTS Writing Task 1 questions:
- The chart below shows the changes in solar power capacity in selected countries between 2000 and 2023. Summarize the information by selecting and reporting the main features, and make comparisons where relevant.
- The table illustrates the solar power capacity of ten countries in 2000, 2010, and 2023. Write a report for a university lecturer describing the information provided.
- The graph compares the growth of solar power capacity in different regions of the world from 2000 to 2023. Analyze the trends shown and report any significant findings.
Sample IELTS Writing Task 1 Question & Data Analysis
Let’s select the first question for our model answer:
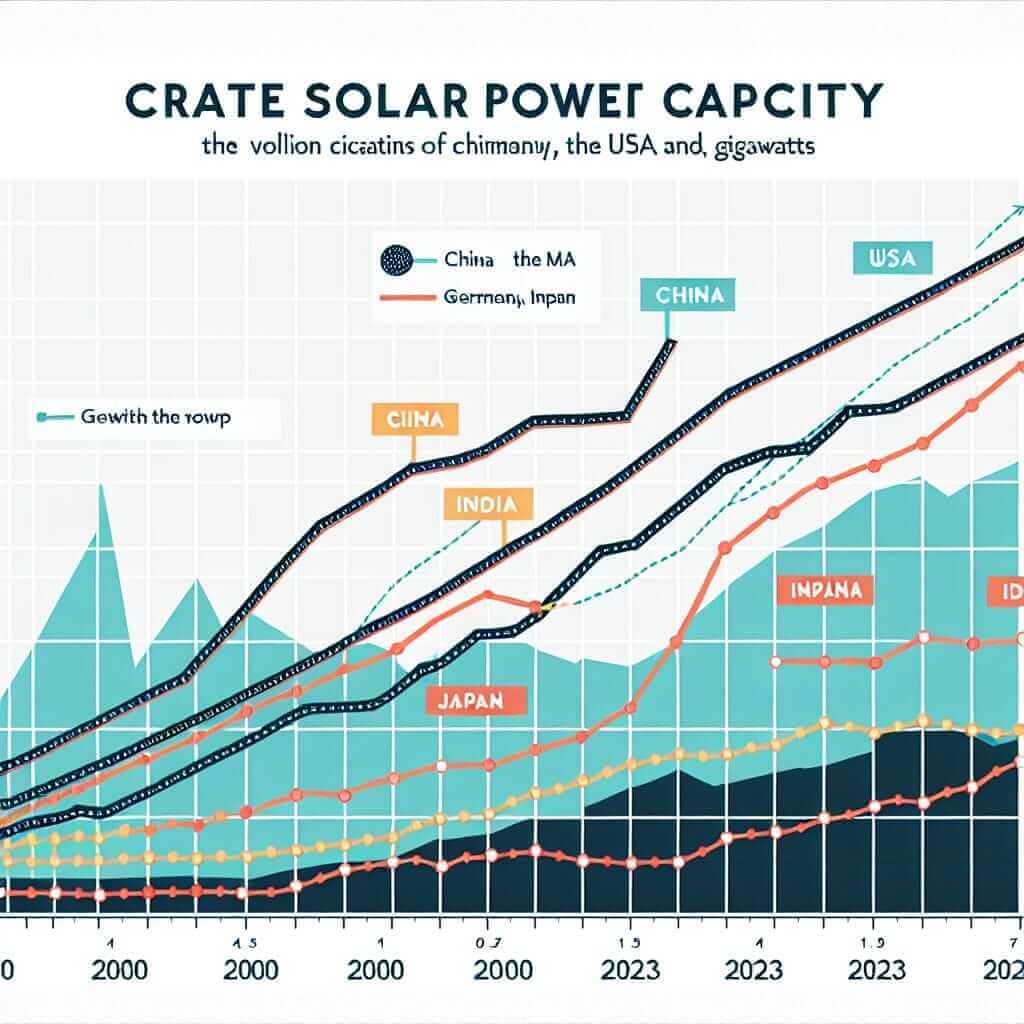
The chart below shows the changes in solar power capacity in selected countries between 2000 and 2023. Summarize the information by selecting and reporting the main features, and make comparisons where relevant.

Data Analysis
Before writing, analyze the provided graph:
- Overall Trend: Is there a general upward or downward trend in solar power capacity globally?
- Individual Country Trends: How does the solar power capacity of each country change over time? Are there periods of rapid growth or stagnation?
- Comparisons: Which countries have the highest and lowest solar power capacities? Are there any notable differences in growth rates between countries?
Model Answer
The line graph illustrates the changes in solar power capacity in five selected countries – China, the USA, Germany, India, and Japan – from 2000 to 2023.
Overall, there has been a dramatic increase in global solar power capacity over the period shown. Notably, China has emerged as the dominant player in this sector.
In 2000, Germany had the highest solar power capacity at just over 1 gigawatt (GW), followed by the USA and Japan with less than 1 GW each. China and India lagged significantly behind with negligible capacity. However, the situation changed drastically in the following years.
China experienced explosive growth in solar power capacity, particularly after 2010. By 2023, its capacity skyrocketed to an estimated 400 GW, dwarfing all other countries. The USA also witnessed substantial growth, reaching approximately 150 GW by 2023.
While Germany, Japan, and India showed a steady increase in solar power capacity, their growth rates paled in comparison to China and the USA. By 2023, Germany reached around 60 GW, Japan reached 25 GW, and India reached approximately 80 GW.
In conclusion, the graph highlights the remarkable global expansion of solar power, with China leading the charge. While other countries have also made progress, the difference in scale underscores China’s significant investment and dominance in this rapidly growing sector. (Word count: 198)
Writing Tips for IELTS Task 1
- Paraphrase the question: Begin by paraphrasing the question prompt in your own words to demonstrate your vocabulary and understanding.
- Overview: Provide a concise overview of the main trends shown in the data.
- Group Data: Categorize the data logically to make comparisons and highlight key features.
- Accurate Reporting: Report the data precisely using appropriate vocabulary for describing trends (e.g., increase, decrease, fluctuate, peak, plateau).
- Language of Comparison: Use comparative and superlative adjectives (e.g., higher, lower, the most significant) to highlight differences and similarities.
Vocabulary for Describing Trends
- Increase: surge, soar, escalate, climb, rise, grow
- Decrease: plummet, plunge, decline, drop, fall, dwindle
- Fluctuate: oscillate, vary, swing
- Peak: reach a peak, culminate in
- Plateau: level off, stabilize
Difficult Vocabulary and Definitions
- Dominant (adjective /ˈdɒm.ɪ.nənt/): More important, powerful, or noticeable than other things.
- Negligible (adjective /ˈneɡ.lɪ.dʒə.bl̩/): Too small in amount to be important or worth considering.
- Drastically (adverb /ˈdræs.tɪ.kəl.i/): In a way that is severe and sudden or has very noticeable effects.
- Skyrocket (verb /ˈskaɪˌrɒk.ɪt/): To rise extremely quickly to a very high level.
- Dwarf (verb /dwɔːf/): To make something seem small or unimportant compared with something else.
Conclusion
Mastering the IELTS Writing Task 1 requires practice, understanding data analysis, and using appropriate vocabulary and grammar. By following the strategies outlined in this guide and practicing with real data sets, you can confidently approach questions related to “solar power capacity by country” and other similar themes, paving the way for a Band 7+ score. Remember to focus on clarity, accuracy, and showcasing your ability to convey information effectively.