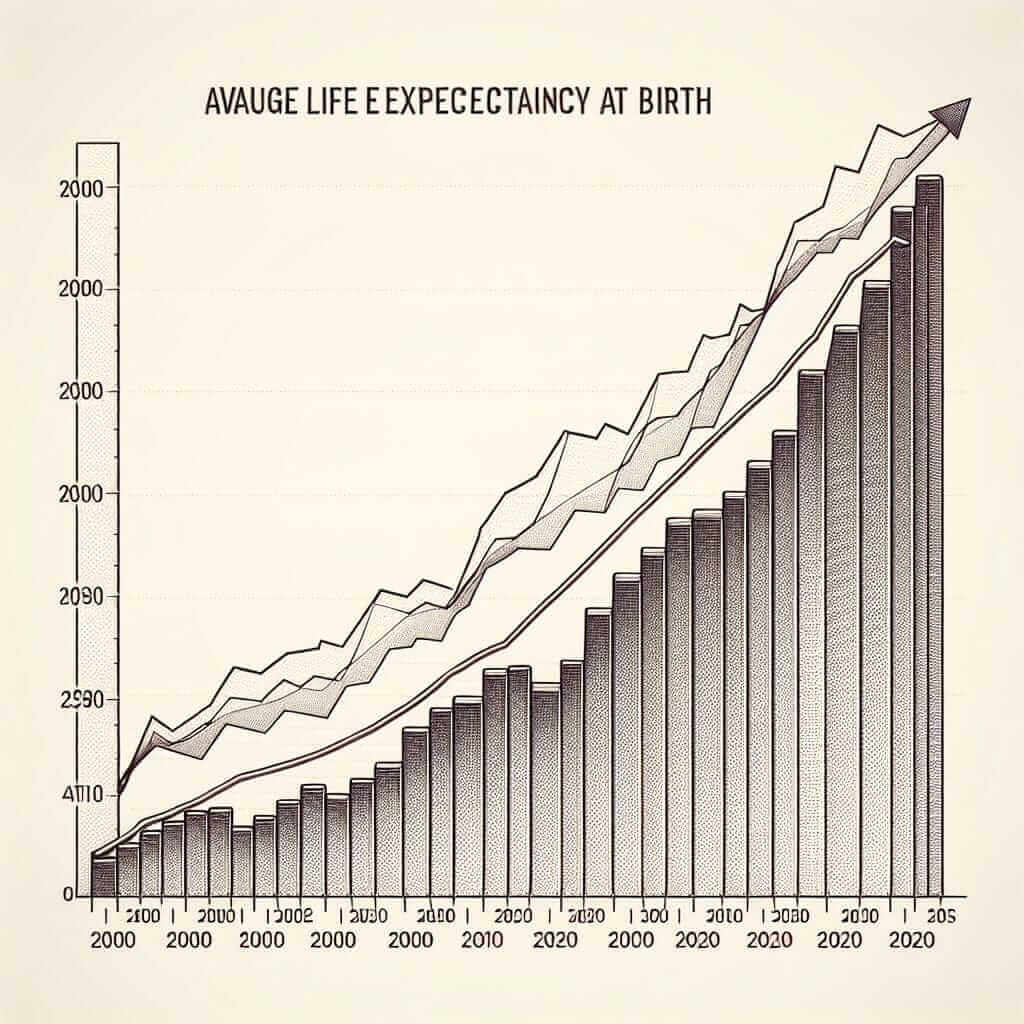
Life expectancy, a key indicator of a population’s health and well-being, often takes center stage in IELTS Writing Task 1. Understanding how to interpret and articulate trends in life expectancy is crucial for achieving a high band score. This article will equip you with the necessary tools and techniques to confidently tackle IELTS Writing Task 1 questions related to “Life Expectancy Trends (2000-2023)”. We’ll analyze potential exam questions, dissect data presentation, and craft a band-worthy model answer.
Sample IELTS Writing Task 1 Questions:
- The line graph below shows the average life expectancy at birth for males and females in a developed country between 2000 and 2020. Summarise the information by selecting and reporting the main features, and make comparisons where relevant.
- The table below provides data on life expectancy at birth and government spending on healthcare in five different countries. Write a report for a university lecturer describing the information shown.
- The chart illustrates the changes in life expectancy in various regions of a country from 2000 to 2020. Summarise the information by selecting and reporting the main features and make comparisons where relevant.
Model Answer and Analysis:
Let’s choose the first question and develop a sample answer:
Question: The line graph below shows the average life expectancy at birth for males and females in a developed country between 2000 and 2020. Summarise the information by selecting and reporting the main features, and make comparisons where relevant.

-
Year Male Life Expectancy Female Life Expectancy 2000 75 80 2005 76 81 2010 78 83 2015 79 84 2020 80 85
Model Answer:
The line graph illustrates the trends in average life expectancy for males and females in a developed nation over a two-decade period, from 2000 to 2020.
Overall, life expectancy for both genders shows a consistent upward trajectory throughout the period. However, females consistently outlive males by an average of 5 years.
At the start of the millennium, men could expect to live to 75 years of age, while women lived an average of 80 years. This gender gap remains relatively stable over the two decades, with life expectancy for both genders increasing at a similar rate.
By 2020, male life expectancy reached 80 years, while females were expected to live to 85, marking a 5-year increase for both genders compared to 2000.
In conclusion, the graph highlights a positive trend in longevity in this developed country, with females consistently experiencing a longer lifespan than males.
Word Count: 154 words
Key Considerations for IELTS Writing Task 1 (Life Expectancy Trends):
Vocabulary:
- Life expectancy: The average number of years a person is expected to live.
- Trend: A general direction of change over a period of time.
- Increase/Decrease: To become larger/smaller in amount or size.
- Significant/Slight/Gradual/Steady/Dramatic: Adjectives used to describe the rate and degree of change.
- Gap: A difference between two things.
- Projection: An estimate or forecast of a future trend.
Grammar:
- Tenses: Use the past simple to describe past trends and the present simple to describe general truths or information that is still relevant.
- Comparatives and Superlatives: Essential for comparing data points.
- Prepositions: Pay attention to prepositions of time (in, on, at, between, from, to) and change (by, to, from).
Challenging Vocabulary:
- Longevity (noun) /lɒnˈdʒevɪti/ : A long duration of life.
- Mortality rate (noun) /mɔːˈtælɪti reɪt/ : The number of deaths in a given period.
- Infant mortality rate (noun) /ˈɪnfənt mɔːˈtælɪti reɪt/ : The number of deaths of infants under one year old per 1,000 live births.
- Demographic (adjective) /ˌdeməˈɡræfɪk/: Relating to the structure of populations.
- Socioeconomic factors (noun) /ˌsoʊsiːoʊˌiːkəˈnɒmɪk ˈfæktərz/ : Factors related to a combination of social and economic conditions.
- Correlation (noun) /ˌkɒrəˈleɪʃn/ : A mutual relationship or connection between two or more things.
- Disparity (noun) /dɪˈspærəti/ : A great difference.
- Fluctuate (verb) /ˈflʌktʃueɪt/ : To rise and fall irregularly in number or amount.
- Plateau (noun) /ˈplætəʊ/ : A state of little or no change following a period of activity or progress.
- Projections (noun) /prəˈdʒekʃənz/ : Estimates or forecasts of future trends.
Conclusion:
Mastering the art of analyzing and writing about life expectancy trends is a valuable asset for IELTS Writing Task 1 success. By familiarizing yourself with common vocabulary, grammatical structures, and effective data interpretation techniques, you’ll be well-prepared to achieve a band score of 7+ on this question type. Remember to practice consistently, analyze model answers, and familiarize yourself with diverse data presentation formats to build your confidence and refine your writing skills.