As an IELTS instructor with over two decades of experience, I’ve witnessed countless students grapple with the diagram description task in the IELTS Speaking test. This seemingly straightforward task often becomes a stumbling block for many. Fear not! With the right approach and consistent practice, you can conquer this challenge and boost your IELTS score.
Understanding the Importance of Diagram Description
The IELTS Speaking test assesses your ability to communicate effectively in English. The diagram description section evaluates your capacity to:
- Interpret visual information: Can you understand the data, trends, and relationships presented in a diagram?
- Organize your thoughts: Can you structure your description logically and coherently?
- Use appropriate vocabulary: Can you employ a range of vocabulary related to processes, changes, comparisons, and trends?
- Speak fluently and accurately: Can you deliver your description smoothly and with grammatical accuracy?
Mastering these skills is not only crucial for achieving a high IELTS score but also invaluable for academic studies, professional presentations, and everyday communication.
Effective Strategies for Describing Diagrams
1. Analyze the Diagram Carefully
Before you utter a word, take a moment to analyze the diagram thoroughly. Identify the key features, such as:
- Type of diagram: Is it a line graph, bar chart, pie chart, process diagram, or map?
- Title and labels: What information do they provide about the data being presented?
- Units of measurement: What units are used (e.g., percentages, years, kilograms)?
- Trends and patterns: Are there any noticeable increases, decreases, fluctuations, or comparisons?
2. Structure Your Description Logically
A well-structured description is easy to follow and understand. Consider using the following framework:
- Introduction (1-2 sentences): Briefly paraphrase the main message conveyed by the diagram. For example, “This line graph illustrates the changes in the price of oil from 2000 to 2020.”
- Overview (2-3 sentences): Highlight the most significant trends or patterns. For example, “Overall, there was a dramatic increase in the price of oil during this period, with two notable peaks in 2008 and 2012.”
- Detailed description (3-4 sentences per key feature): Describe specific details, using appropriate vocabulary and grammar structures. For example, “Between 2000 and 2005, the price of oil remained relatively stable, hovering around $30 per barrel. However, from 2005 onwards, there was a sharp upward trend, reaching a peak of $140 per barrel in 2008.”
- Conclusion (1-2 sentences): Summarize the main points and offer a concluding remark if applicable.
3. Utilize a Rich Vocabulary
Employ a variety of vocabulary to describe trends, changes, and comparisons. Some useful words and phrases include:
- Trends: increase, decrease, rise, fall, fluctuate, remain stable, peak, trough, plateau
- Changes: gradual, sharp, dramatic, significant, slight, steady, rapid
- Comparisons: higher than, lower than, similar to, in contrast to, twice as much as, half as much as
Remember to use appropriate grammatical structures, such as prepositions of time (from, to, between, during), adverbs of frequency (always, often, sometimes, rarely, never), and comparative and superlative adjectives (higher, highest, lower, lowest).
Illustrative Example from IELTS Speaking Test
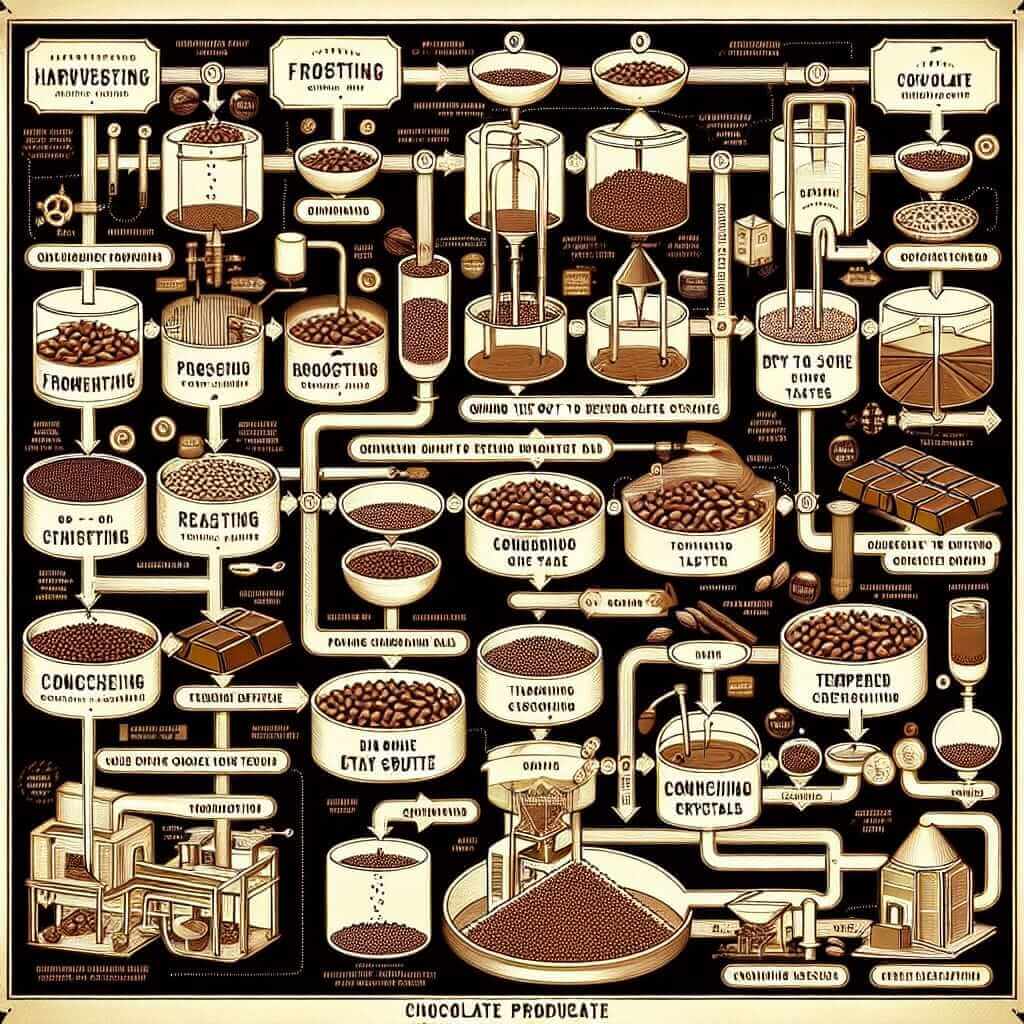
The diagram below shows the process of making chocolate.

(Image of a chocolate-making process diagram)
Describe the process shown in the diagram.
Sample Answer:
The diagram illustrates the various stages involved in the production of chocolate, from cocoa beans to the finished product. Initially, cocoa beans are harvested and fermented before being dried and roasted. Following this, the roasted beans are ground into a paste known as chocolate liquor. This liquor is then pressed to separate the cocoa solids from the cocoa butter. Subsequently, sugar and milk powder are added to the cocoa solids, and the mixture undergoes a process called conching, which involves prolonged mixing and heating to develop flavor and texture. Finally, the chocolate is tempered, molded into desired shapes, and packaged for distribution.
Tips for Success
- Practice regularly: Familiarize yourself with various diagram types and practice describing them aloud, timing yourself to simulate the exam conditions.
- Record yourself: Listening to your recordings can help you identify areas for improvement in terms of fluency, pronunciation, and vocabulary.
- Seek feedback: Ask your IELTS instructor or a language partner to evaluate your descriptions and provide constructive criticism.
- Expand your vocabulary: Make a conscious effort to learn and use new words and phrases related to describing data and processes.
By following these tips and dedicating sufficient time to practice, you’ll be well-equipped to confidently tackle the diagram description task in the IELTS Speaking test. Remember, clarity, coherence, and vocabulary are key!