Comparing statistical data over time is a common task in the IELTS Writing Task 1. One frequent topic is comparing the number of hospitals in urban and rural areas over a specified period. This topic not only tests your ability to describe trends and differences but also your proficiency in using the appropriate vocabulary and grammar to do so.
In this lesson, we will explore an example task related to this topic, provide a detailed analysis, and offer a sample answer. Along the way, we will highlight key vocabulary and grammar structures that will help you excel in this type of task.
Sample Task
The following is a sample task that you might encounter in the IELTS Writing Task 1:
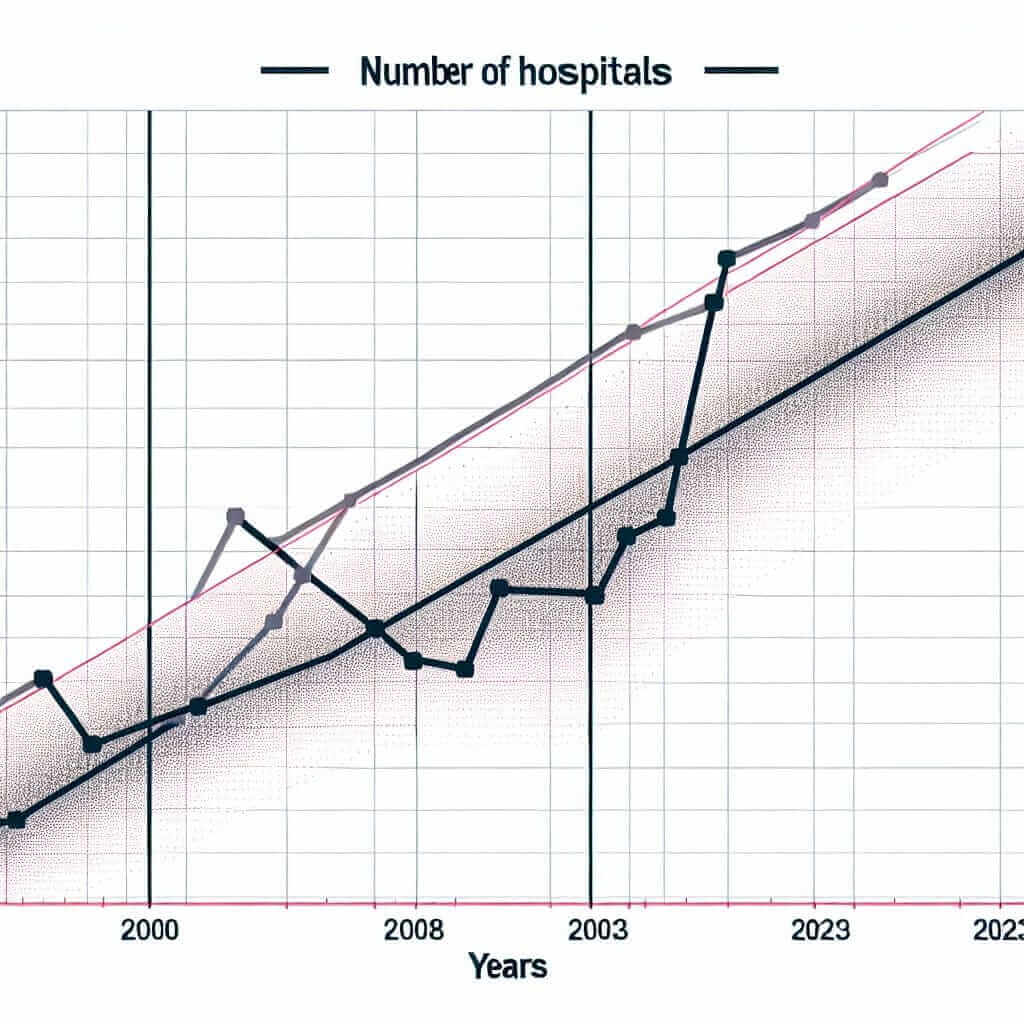
The graph below shows the number of hospitals in urban and rural areas from 2000 to 2023. Summarize the information by selecting and reporting the main features, and make comparisons where relevant.

Data Representation
First, let’s create a hypothetical dataset to illustrate the numbers of hospitals in urban and rural areas from 2000 to 2023. We can represent this data in a table format for clarity:
| Year | Urban Areas | Rural Areas |
|---|---|---|
| 2000 | 500 | 300 |
| 2005 | 550 | 320 |
| 2010 | 600 | 330 |
| 2015 | 650 | 350 |
| 2020 | 700 | 370 |
| 2023 | 720 | 380 |
Analyzing the Task
When analyzing this task, consider the following steps:
- Identify Key Trends: Look at how the numbers have changed over time. Are there any noticeable increases or decreases?
- Compare Figures: Compare the number of hospitals in urban areas to those in rural areas for each specific year.
- Highlight Differences and Similarities: Make note of any years where significant changes occur or where the numbers are particularly close or far apart.
Sample Answer
Below is a sample answer to the task, written to a Band 7+ standard. Note that this answer incorporates a variety of complex sentences, appropriate vocabulary, and provides a clear and logical structure.
The graph illustrates the number of hospitals in urban and rural areas from the year 2000 to 2023. Overall, it is evident that while both urban and rural areas have seen an increase in the number of hospitals, the growth has been more pronounced in urban areas.
In 2000, there were 500 hospitals in urban areas compared to 300 in rural regions. Over the next five years, the number of urban hospitals rose steadily to 550, whereas rural hospitals increased slightly to 320. This trend continued in the subsequent years, with urban hospitals reaching 600 and rural hospitals at 330 by 2010.
From 2010 to 2015, both urban and rural areas experienced a more significant growth. In urban areas, the number of hospitals grew by 50, totaling 650, while in rural areas, the increase was less pronounced, amounting to 350 hospitals. The period between 2015 and 2020 saw urban hospitals continue to rise, hitting 700, whereas rural hospitals continued their gradual growth to 370.
By 2023, the number of hospitals in urban areas had reached 720, maintaining a steady increase, whereas rural hospitals had a slower growth rate, culminating in 380 institutions. Although both regions exhibited growth, the gap between urban and rural hospitals widened over the period, reflecting a more considerable advancement in urban healthcare infrastructure.
In conclusion, the graph highlights a consistent upward trend in the number of hospitals in both urban and rural areas, with urban hospitals demonstrating a more substantial increase over the given period.
Word count: 240
Key Considerations for Writing About This Topic
- Use Comparative Structures: Employ phrases like “more pronounced”, “less significant”, “steadily increasing”, etc., to compare numbers.
- Describe Trends: Use verbs such as “rise”, “increase”, “grow”, “decline”, and adjectives like “steady”, “sharp”, “gradual” to describe changes.
- Provide Clear Summaries: Make sure your summary is concise and covers the main trends and comparisons.
Vocabulary to Remember
- Pronounced (adj) /prəˈnaʊnst/: very noticeable or marked.
- Steady (adj) /ˈstɛd.i/: gradual and consistent over time.
- Gradual (adj) /ˈɡrædʒ.u.əl/: happening over a period of time rather than suddenly.
- Significant (adj) /sɪɡˈnɪf.ɪ.kənt/: important and worthy of attention.
- Institution (n) /ˌɪn.stɪˈtjuː.ʃən/: an established organization, especially one dedicated to education, public service, or culture.
Conclusion
To tackle Writing Task 1 effectively and achieve a high band score, it’s essential to accurately describe the data, identify key trends, and make relevant comparisons. Practicing with different types of data, such as the number of hospitals in urban and rural areas, will help you become more adept at interpreting and summarizing information, thereby enhancing your overall performance in the IELTS exam.