In this lesson, we will delve into the topic of “Average Monthly Household Expenditure (2000-2023)”—a subject that has frequently appeared in IELTS writing task 1. This comprehensive analysis will guide you through the essentials of crafting a high-scoring response by offering a detailed breakdown of the topic, an example task, and a model answer. We’ll also focus on the specific vocabulary and grammatical structures relevant to this topic to help you achieve a Band 7+ score.
Understanding the Task
Before we jump into the specifics, let’s look at what kind of questions related to “Average Monthly Household Expenditure (2000-2023)” you might encounter in your IELTS writing task 1. Here’s an example prompt:
Task Example 1:
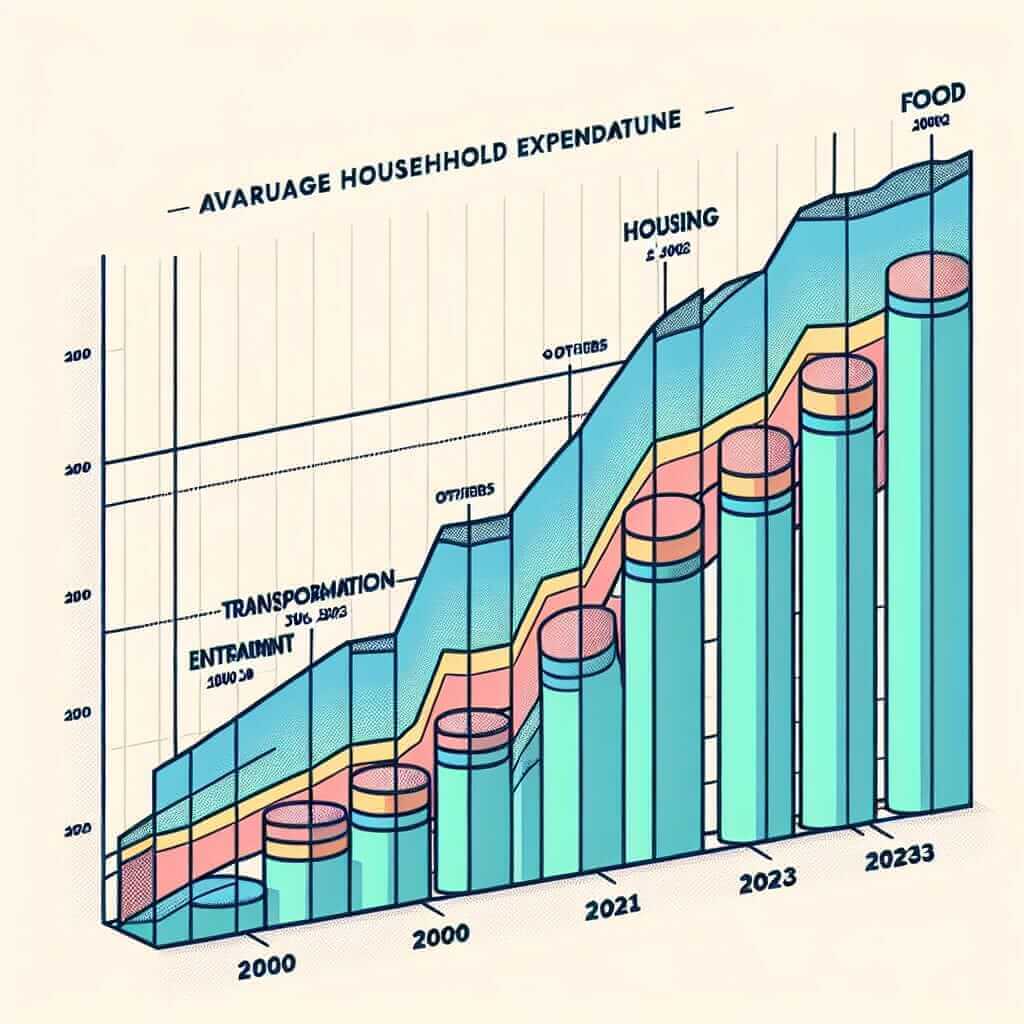
The line graph below shows the average monthly household expenditure in Country X from 2000 to 2023. Summarise the information by selecting and reporting the main features, and make comparisons where relevant.
Choosing a Task and Creating Data
Let’s go ahead with Task Example 1 and create a sample line graph for it. For the sake of this exercise, we’ll generate some hypothetical data.
Line Graph Data
| Year | Food ($) | Housing ($) | Transportation ($) | Entertainment ($) | Others ($) |
|---|---|---|---|---|---|
| 2000 | 300 | 400 | 150 | 100 | 50 |
| 2005 | 350 | 450 | 170 | 120 | 60 |
| 2010 | 400 | 550 | 200 | 140 | 70 |
| 2015 | 450 | 600 | 230 | 160 | 80 |
| 2020 | 500 | 650 | 250 | 180 | 90 |
| 2023 | 520 | 670 | 260 | 190 | 100 |

Analyzing the Task
The primary aim here is to understand the trends and fluctuations in the data from 2000 to 2023. We need to summarize the key features and make comparisons where relevant.
Key Points to Note:
- Overall trends in each category (e.g., steady increase in expenditure on food).
- Any significant peaks or drops.
- Relative expenditure in different categories.
Model Answer
Let’s now create a model answer for the provided data.
The line graph illustrates the average monthly household expenditure in Country X across five categories from 2000 to 2023.
Overall, there is a noticeable increase in spending across all categories over the years. Among the categories, housing consistently recorded the highest expenditure, whereas expenditure on ‘others’ was the least throughout the period.
In 2000, housing had the highest expenditure at $400, followed by food at $300, transportation at $150, entertainment at $100, and others at $50. By 2023, expenditure on housing had risen to $670, maintaining its top position. Similarly, spending on food increased significantly to $520, showing an upward trend.
Transportation and entertainment also witnessed consistent increases. Transportation expenses rose from $150 in 2000 to $260 in 2023. Entertainment expenditure, although the smallest increase in absolute terms, expanded from $100 to $190 during the same period.
The “others” category saw the most minimal increase, advancing only by $50 over the 23 years. This indicates a relatively minor allocation of the household budget to miscellaneous expenses compared to other categories.
In conclusion, while all categories experienced growth, housing and food remained the highest priorities in household expenditure, reflecting typical living cost trends.
Word Count: 202
Key Vocabulary and Grammar
Vocabulary:
- Noticeable (adj) /ˈnəʊtɪsəbəl/: Clear, evident
- Consistently (adv) /kənˈsɪstəntli/: In a consistent manner over time
- Steady (adj) /ˈstɛdi/: Gradual, even, and continuous in development
- Fluctuate (v) /ˈflʌktʃueɪt/: Rise and fall irregularly in number or amount
- Allocation (n) /ˌæləˈkeɪʃən/: The distribution of resources or duties
Grammar:
- Comparative Structures: E.g., higher than, less than, the least, the most
- Past Simple and Present Perfect: E.g., “By 2023, expenditure had risen to…”, “Transportation expenses rose from…”
- Noun Phrases for summarizing data: E.g., “a significant increase,” “the highest expenditure.”
Conclusion
To excel in IELTS writing task 1, you need to accurately interpret data, highlight key trends, and make clear comparisons. Remember to use varied vocabulary and appropriate grammatical structures. Practice makes perfect, so keep practicing with different types of data sets to build your proficiency. Good luck!