Understanding current trends and historical data is essential for excelling in the IELTS Writing Task 1. One common task involves interpreting data from graphs or charts regarding sales trends over a period. In this article, we will explore the sales of various types of electronic devices from 2000 to 2023. This overview will provide valuable insights into writing a comprehensive IELTS Writing Task 1 response.
Introduction
Sales trends for electronic devices, including smartphones, laptops, and tablets, have drastically changed from 2000 to 2023. Recognizing these trends and how to articulate them is crucial for IELTS candidates. This type of data is frequently seen in IELTS Writing Task 1, where candidates must summarize and report the main features of a selection of data, usually represented in visual formats like line graphs or bar charts.
Sample Task
Here are three potential IELTS Writing Task 1 prompts related to electronic device sales data:
- Line Graph: The graph below shows the sales of smartphones, laptops, and tablets from 2000 to 2023. Summarize the information by selecting and reporting the main features, and make comparisons where relevant.
- Bar Chart: The bar chart illustrates the annual sales for three categories of electronic devices (smartphones, laptops, tablets) from 2000 to 2023.
- Table: The table presents the sales numbers in millions for smartphones, laptops, and tablets for selected years between 2000 and 2023.
Chosen Task for Detailed Analysis
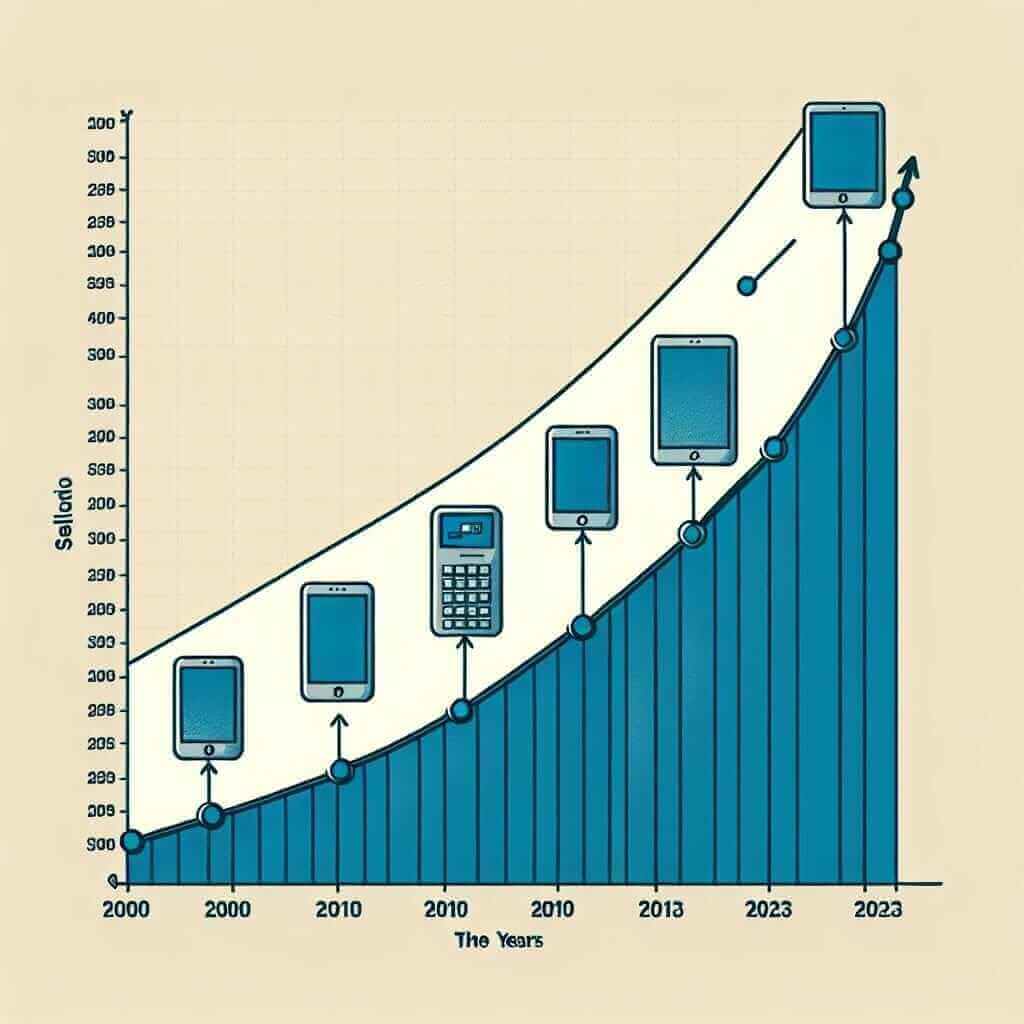
We will focus on the first prompt involving a line graph. Below is the relevant data:
The line graph compares the sales of three different types of electronic devices – smartphones, laptops, and tablets – between 2000 and 2023.

Data Analysis
Interpreting the Graph
Sales trends can be identified by examining the peaks, troughs, and overall trajectory of the lines representing each device category.
Key Observations:
- Smartphones: Demonstrated a rapid increase in sales, especially after 2005, peaking around 2020.
- Laptops: Steady growth initially with a slight decline post-2015 but stabilizing around 2018.
- Tablets: Experienced a surge post-2010, peaking by 2015, then gradually declining.
Sample Response
Here is a model response to the given line graph task:
Model Answer
The line graph illustrates the sales trends for smartphones, laptops, and tablets from 2000 to 2023. Overall, it is evident that the sales of smartphones and tablets have shown significant growth, whereas laptop sales have remained relatively stable with minor fluctuations.
From 2000 to 2005, laptops saw a gradual increase in sales from 10 million to around 50 million units, while smartphone sales remained minimal at approximately 5 million units, and tablet sales were almost non-existent. Post-2005, smartphone sales began to rise sharply, reaching about 200 million units by 2015 before continuing to peak at roughly 300 million units by 2020.
In contrast, laptops maintained steady growth with sales peaking at 150 million units by 2010 before experiencing a slight decline and then stabilizing at around 120 million units from 2018 onwards. Tablets saw a significant rise starting in 2010, peaking at 150 million units in 2015, mirroring the sales of laptops before showing a gradual decline to about 100 million units by 2023.
In conclusion, while laptops experienced moderate growth and relative stability, smartphones and tablets have dominated the market in recent years, with smartphones particularly showing impressive sales figures.
Word count: 202
Writing Tips
Vocabulary and Grammar Points
-
Vocabulary:
- Rapid Increase: A sharp rise in something.
- Peaking: Reaching the highest point.
- Stabilizing: Becoming steady or unchanging.
- Fluctuations: Changes or variations in levels.
- Dominated: To be the most significant or noticeable.
-
Grammar:
- Comparative Structures: “Sales of smartphones rose more sharply than those of laptops.”
- Past Simple and Continuous: “Smartphone sales peaked in 2020” vs. “Smartphone sales were rising sharply post-2005.”
- Passive Voice: “Sales were stabilized at around 120 million units.”
Words to Remember
- Fluctuation (noun) /ˌflʌk.tʃʊˈeɪ.ʃən/: an irregular rising and falling in number or amount.
- Trajectory (noun) /trəˈdʒek.tər.i/: the path followed by a projectile or an object moving under given forces.
- Stabilize (verb) /ˈsteɪ.bəl.aɪz/: make or become unlikely to change, fail, or decline.
- Impressive (adjective) /ɪmˈprɛsɪv/: evoking admiration through size, quality, or skill.
- Dominant (adjective/noun) /ˈdɒmɪnənt/: having power and influence over others.
Conclusion
To attain a Band 7+ score in IELTS Writing Task 1, it is crucial to effectively summarize and compare data from visual inputs. Pay close attention to key trends, peaks, and troughs in the data while using varied vocabulary and appropriate grammatical structures to enhance your response. Practice by analyzing different types of graphs and charts to become proficient in this task type.