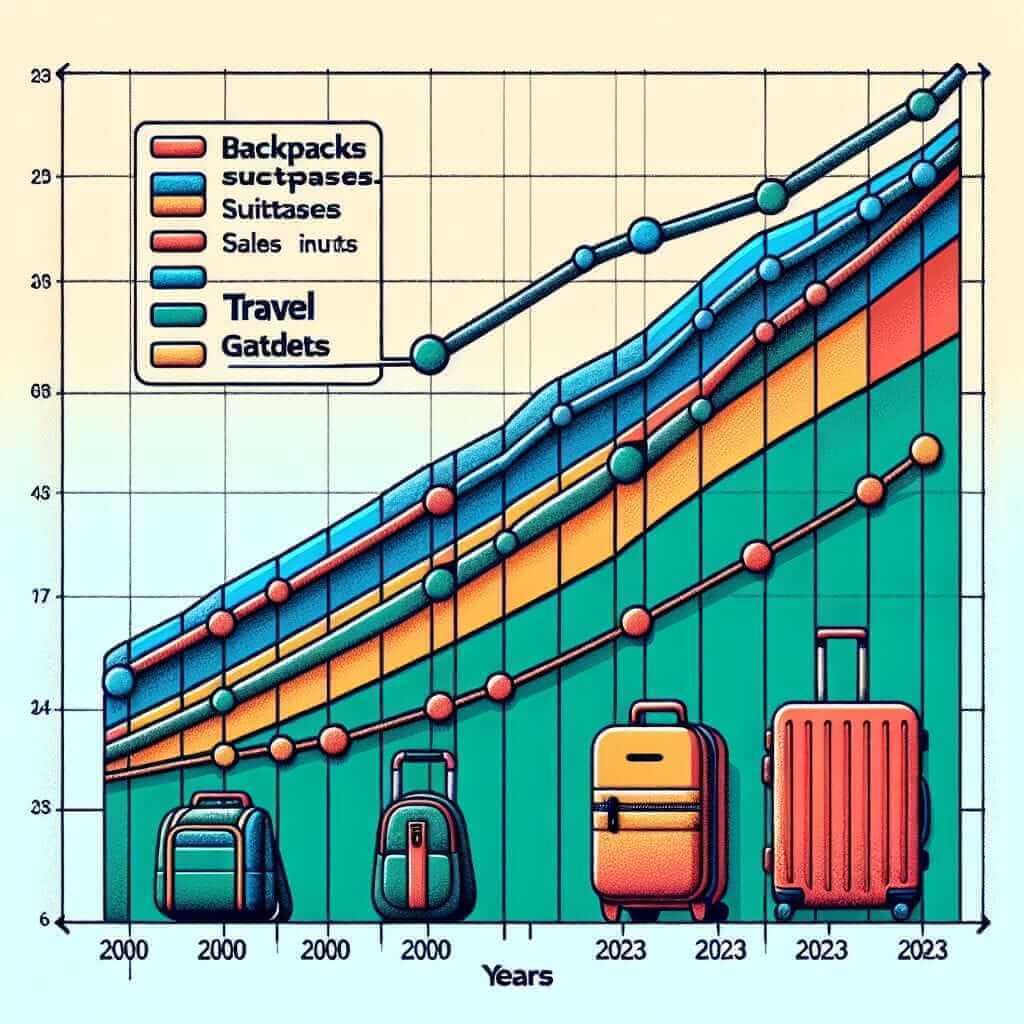
When preparing for the IELTS writing task 1, it’s essential to understand how to analyze and describe trends and data presented in various forms, such as tables, charts, or graphs. This skill is particularly valuable when dealing with topics related to sales trends over a specified period. In this lesson, we will focus on “Sales of Different Types of Travel Gear (2000-2023)” to illustrate the nuanced approach needed to excel in this part of the IELTS exam. We will explore examples, perform detailed analyses, and provide a model answer for practice.
1. Useful Context and Introduction
In the IELTS Writing Task 1, you are likely to encounter numerous graph types, such as line graphs, bar charts, and tables. Let’s consider an example where you are given data about the sales of various types of travel gear from 2000 to 2023. You might be tasked with summarizing the information, identifying trends, comparing data, and noting any significant changes.
Here are three sample prompts related to our topic:
- The line graph below shows the sales of backpacks, suitcases, and travel gadgets from 2000 to 2023. Summarize the information by selecting and reporting the main features and make comparisons where relevant.
- The table below illustrates the annual sales of different types of travel gear (backpacks, suitcases, travel gadgets) between 2000 and 2023. Summarize the information by selecting and reporting the main features and make comparisons where relevant.
- The bar chart below depicts the sales of travel gear, including backpacks, suitcases, and travel gadgets, over a period from 2000 to 2023. Summarize the information by selecting and reporting the main features and make comparisons where relevant.
For this lesson, we will focus on the first prompt, involving a line graph.
2. Data Representation and Analysis
To create a detailed example, we have synthesized the following hypothetical line graph data:
Hypothetical Line Graph Data
| Year | Backpacks (Million Units) | Suitcases (Million Units) | Travel Gadgets (Million Units) |
|---|---|---|---|
| 2000 | 10 | 15 | 5 |
| 2005 | 20 | 25 | 10 |
| 2010 | 30 | 35 | 20 |
| 2015 | 40 | 45 | 30 |
| 2020 | 35 | 55 | 40 |
| 2023 | 50 | 65 | 45 |
Analyzing the Data
Before writing, we must analyze and interpret the data.
- Backpacks: Sales began at 10 million units in 2000, gradually increasing to 40 million in 2015, dipping slightly to 35 million in 2020, and rising significantly to 50 million by 2023.
- Suitcases: Starting at 15 million units in 2000, sales steadily rose to 45 million by 2015 and continued to climb to 65 million by 2023.
- Travel Gadgets: These saw an upward trend from 5 million units in 2000 to a peak of 45 million units in 2023, with the most significant surge between 2015 and 2023.

3. Sample Writing Response
Task Analysis
We need to summarize the trend of each travel gear type over the given period and compare where relevant.
Model Answer
Here is a model answer based on the provided data, adhering to IELTS band 7+ criteria:
The line graph illustrates the sales of backpacks, suitcases, and travel gadgets from 2000 to 2023 in million units. Overall, all categories experienced significant sales growth over this period, though at varying rates.
Initially, backpacks began with modest sales of 10 million units in 2000, progressively escalating to 40 million by 2015. However, there was a brief decline to 35 million in 2020, before a substantial increase to 50 million units by 2023. In contrast, suitcases, starting at 15 million units in 2000, demonstrated a consistent upward trajectory, reaching a noteworthy 65 million units by 2023.
Travel gadgets started with the lowest sales among the three items, at 5 million units in 2000. From 2000 until 2010, the increase was gradual but steadier over the subsequent years, reaching 30 million units by 2015. The most significant growth occurred between 2015 and 2023, where sales soared to 45 million units.
In summary, while backpacks and travel gadgets exhibited fluctuating growth, suitcases enjoyed a more continuous increase in sales throughout the specified timeframe. Notably, the period from 2015 to 2023 saw the most dramatic increases across all categories, highlighting the growing demand for travel-related items.
Word count: 207
4. Key Vocabulary and Grammar Notes
Vocabulary
- Illustrates (verb): /ˈɪl.ə.streɪts/ – to show or explain something through examples or visuals.
- Significant (adjective): /sɪɡˈnɪf.ɪ.kənt/ – important or noticeable.
- Trajectory (noun): /trəˈdʒek.tər.i/ – the path followed by an object moving under given forces.
- Gradual (adjective): /ˈɡrædʒ.u.əl/ – taking place or progressing slowly.
- Substantial (adjective): /səbˈstæn.ʃəl/ – of considerable importance, size, or worth.
- Noteworthy (adjective): /ˈnəʊtˌwɜː.ði/ – deserving attention because of being unusual or interesting.
- Fluctuating (adjective): /ˈflʌk.tʃu.eɪ.tɪŋ/ – rising and falling irregularly in number or amount.
Grammar Notes
-
Comparison Structures: Use words and phrases like “while,” “in contrast,” “significantly,” “more continuous” to compare different data points.
- Example: “While backpacks showed varying trends, suitcases exhibited a more continuous rise.”
-
Summarizing Trends:
- Utilize present perfect forms and past simple to describe trends over time.
- Example: “Sales of travel gadgets have seen a steady increase since 2000.”
5. Conclusion
When dealing with IELTS Writing Task 1, it’s vital to accurately summarize and compare data, emphasizing significant trends and differences. Using appropriate vocabulary, clear comparative structures, and adhering to the data’s storyline are keys to securing a high band score. Practice analyzing and writing about different data sets will enhance your skills and confidence, paving the way for success in the IELTS exam.