Renewable energy investment has become a crucial topic in recent years, reflecting the global shift towards sustainable energy sources. This topic is often encountered in the IELTS Writing Task 1, where test takers interpret data from line graphs, bar charts, or tables. This article aims to provide an in-depth analysis of how to approach such questions, focusing on renewable energy investments in various countries from 2000 to 2023.
Understanding the Topic and Frequency in IELTS
“Renewable Energy Investments” is a common theme in IELTS exams, reflecting its significance in modern developments. Candidates might be asked to analyze trends, compare data, or discuss patterns using different types of visual representation. Below are some example tasks related to this topic:
-
Line Graph: “The graph below shows the amount of money invested in renewable energy by five different countries from 2000 to 2023. Summarize the information by selecting and reporting the main features and make comparisons where relevant.”
-
Bar Chart: “The bar chart illustrates the investments made in solar and wind energy in four countries between 2000 and 2023. Summarize the information by selecting and reporting the main features and make comparisons where relevant.”
-
Table: “The table shows the investment amounts in renewable energy sources in six countries over the period from 2000 to 2023. Summarize the information by selecting and reporting the main features and make comparisons where relevant.”
Analyzing a Sample Task
For this article, we will focus on the following sample task:
Example Task:
“The graph below shows the amount of money invested in renewable energy by five different countries (United States, China, Germany, India, and Brazil) from 2000 to 2023. Summarize the information by selecting and reporting the main features and make comparisons where relevant.”
Data Representation:
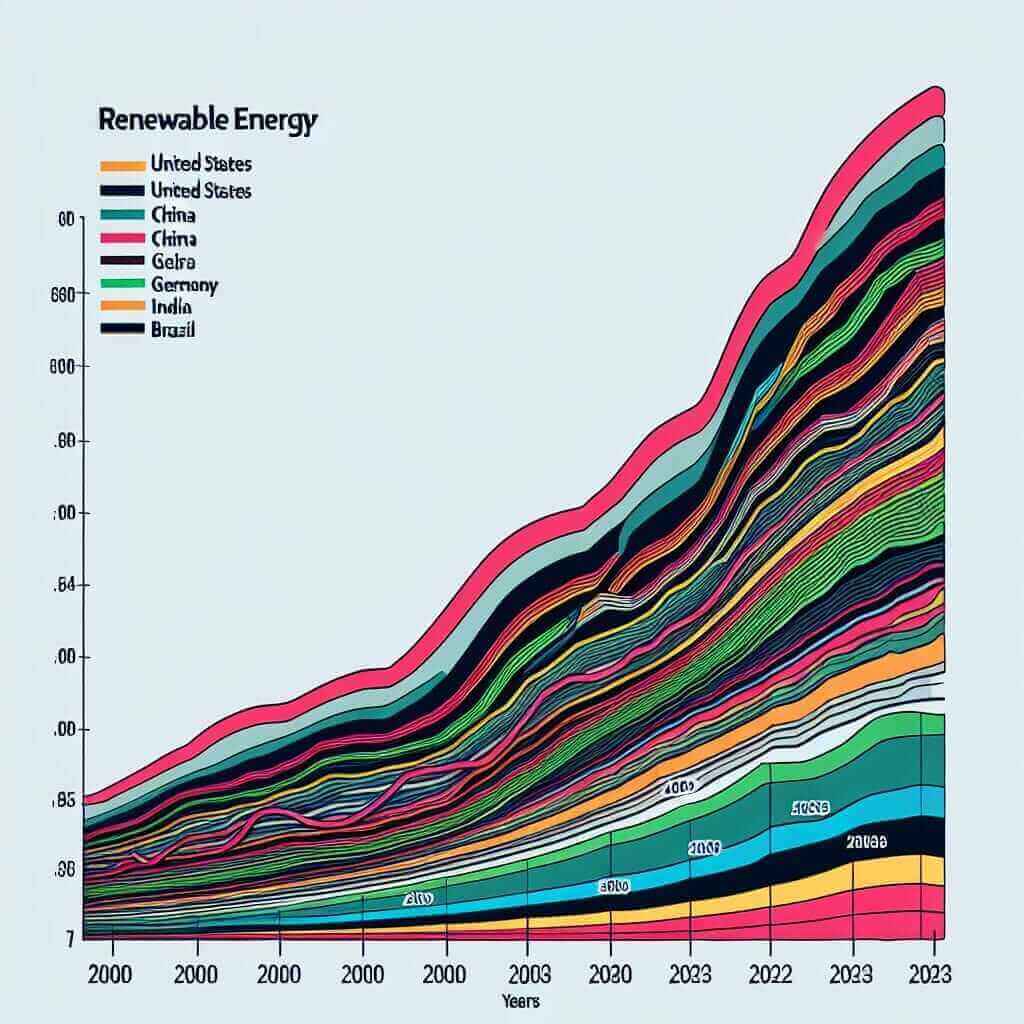
Below is a hypothetical line graph created for this example task:

Breaking Down the Task
1. Identifying Key Data Points
- Overview: Notice the overall trends in investment over the years.
- Peak Points: Identify which years saw the highest investments for each country.
- Comparison: Compare investments between different countries.
2. Writing the Report
a. Introduction
Introduce the graph with a paraphrase of the task prompt.
b. Overview
Provide a summary of the main features such as general trends and major peaks.
c. Detailed Paragraphs
Explain specific data points, trends, and comparisons between countries.
Sample Report
Introduction:
The graph illustrates the amount of money invested in renewable energy by five countries from 2000 to 2023.
Overview:
Overall, investments in renewable energy have increased across all five countries over the period. Notably, China and the United States have witnessed the most significant growth, whereas Germany and Brazil show more moderate increases. India, although showing a rise, lags behind other nations in total investments.
Body Paragraph 1:
From 2000 to 2010, the United States consistently invested more in renewable energy than any other country, reaching a peak of $50 billion in 2010. Meanwhile, China’s investments, which started at just $5 billion in 2000, saw a rapid increase and surpassed the United States in 2015 with $60 billion invested.
Body Paragraph 2:
Germany’s investment pattern shows steady growth with minor fluctuations, reaching $40 billion by 2020. Brazil and India, on the other hand, show relatively modest increases. By 2023, Brazil’s investments reached $30 billion, whereas India, starting with only $2 billion in 2000, managed to invest $25 billion.
Key Vocabulary and Grammar Points
- Trends: “increased steadily,” “peaked,” “fluctuated,” “surpassed.”
- Comparisons: “more than,” “less than,” “the highest,” “the lowest.”
- Data Points: “amounted to,” “reached,” “starting at.”
Sample Vocabulary List:
- Investment (n) /ɪnˈvɛst.mənt/: The action or process of investing money for profit.
- Fluctuate (v) /ˈflʌk.tʃu.eɪt/: Rise and fall irregularly in number or amount.
- Peak (v) /piːk/: Reach a highest point, either of a specified value or at a specified time.
- Moderate (adj) /ˈmɒd.ər.ət/: Average in amount, intensity, quality, or degree.
- Renewable (adj) /rɪˈnjuː.ə.bəl/: Relating to energy from a source that is not depleted when used.
Conclusion
To effectively tackle IELTS Writing Task 1, it is essential to understand the visual data provided, identify key trends and comparisons, and use appropriate vocabulary and grammar structures. Practicing with topics like “Renewable Energy Investments” will enhance your ability to describe complex data accurately and cohesively, aiming for a Band 7+ score.
By consistently practicing and applying these techniques, you will gain confidence and proficiency in IELTS Writing Task 1.
(Word count: 407)