Understanding trends in household spending on food and drink is a significant aspect of mastering the IELTS Writing Task 1. This topic occurs frequently in various forms, such as line graphs, bar charts, pie charts, and tables. This guide will help you navigate this topic effectively, providing valuable insights and examples.
Introduction
The IELTS Writing Task 1 often requires candidates to describe and analyze visual data. One recurring topic is the “Average Household Spending on Food and Drink.” Here are three potential essay questions you might encounter:
- “The graph below shows the average household spending on food and drink in a certain country from 2000 to 2023. Summarize the information by selecting and reporting the main features, and make comparisons where relevant.”
- “The table illustrates the average household expenditure on food and drink in different regions between 2000 and 2023. Summarize the information by selecting and reporting the main features, and make comparisons where relevant.”
- “The chart below provides information about average household spending on food and drink over a period from 2000 to 2023. Summarize the information by selecting and reporting the main features, and make comparisons where relevant.”
For this article, we will choose the first question to create a detailed model answer.
Chosen Task
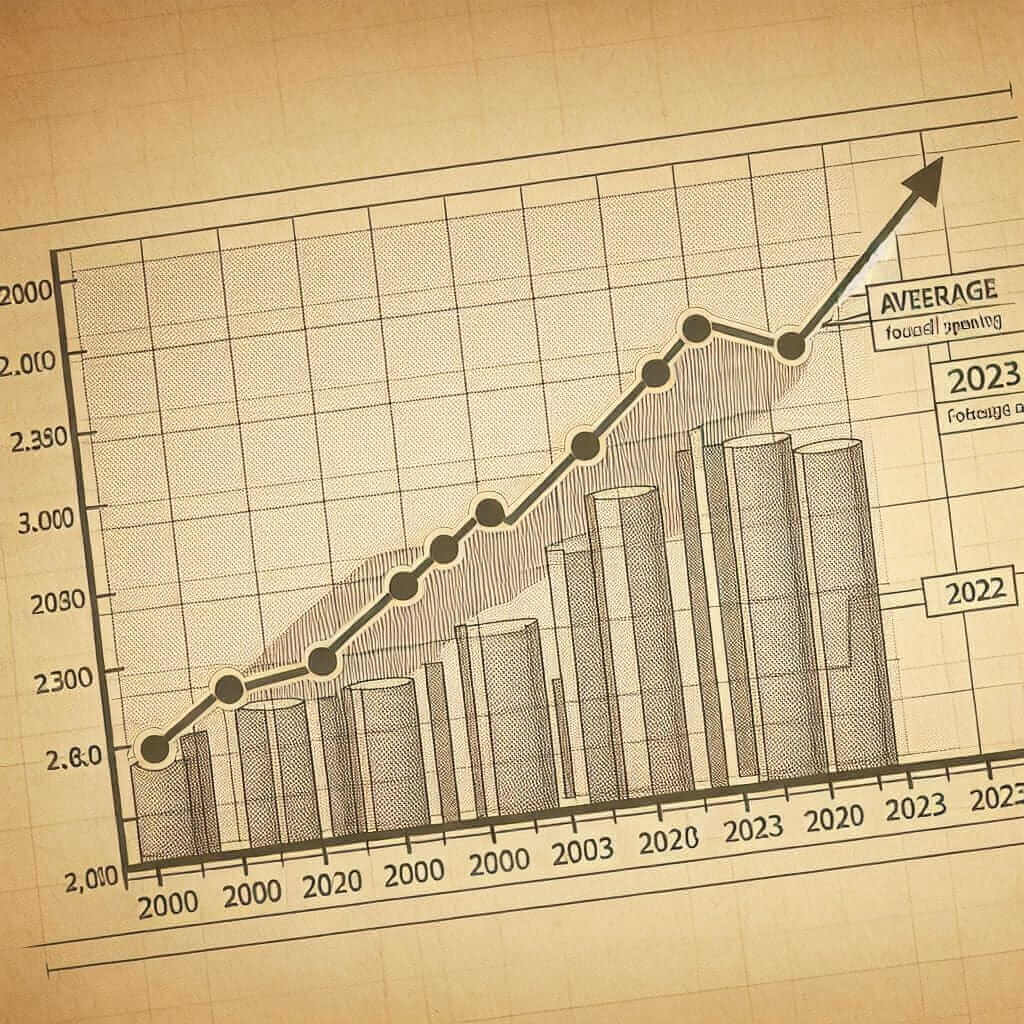
Task: “The graph below shows the average household spending on food and drink in a certain country from 2000 to 2023. Summarize the information by selecting and reporting the main features, and make comparisons where relevant.”
Data Representation
For this example, let’s assume we found the following data:
| Year | Spending (in $) |
|---|---|
| 2000 | 150 |
| 2003 | 180 |
| 2006 | 200 |
| 2009 | 220 |
| 2012 | 240 |
| 2015 | 260 |
| 2018 | 280 |
| 2021 | 290 |
| 2023 | 300 |

Analysis of the Task
Understanding the Data
The line graph details the average household spending on food and drink from 2000 to 2023. Key observations include:
- A consistent upward trend.
- Significant increases, particularly noticeable around 2009 and 2015.
- A steady but slower increase after 2018.
Report Structure
- Introduction: Paraphrase the task.
- Overview: Provide a summary of the overall trend.
- Details: Highlight specific years and data points, making comparisons where relevant.
Model Answer
The graph illustrates the average expenditure on food and drink by households in an unnamed country over the period from 2000 to 2023. Generally, there is a clear upward trend in spending.
From 2000 to 2003, there is a noticeable rise from $150 to $180, showing an increase of $30. This upward trajectory continues, reaching $200 by 2006. The most significant growth occurs between 2006 and 2009, where spending jumps from $200 to $220. Similarly, spending increases steadily, reaching $240 in 2012 and $260 in 2015.
Between 2018 and 2021, the growth rate appears to decelerate slightly, with spending climbing just $10 from $280 to $290. The trend persists steadily through to 2023, with an average expenditure of $300.
Overall, it is clear that household spending on food and drink has continually increased over the given period.
Word Count: 152
Key Considerations When Writing
Vocabulary and Grammar
-
Upward Trend Phrases:
- “There is a clear upward trend…”
- “Noticeable rise from… to…”
- “Steady increase to…”
-
Comparison Language:
- “In contrast, …”
- “Meanwhile, …”
- “Compared to…”
Important Vocabulary
-
Expenditure (n)
- /ɪkˈspendɪt͡ʃəʳ/
- The action of spending funds.
-
Trajectory (n)
- /trəˈdʒɛktəri/
- The path followed by a moving object or an overall trend.
-
Decelerate (v)
- /dɪˈseləreɪt/
- Reduce the speed of; slow down the rate of.
-
Significant (adj)
- /sɪɡˈnɪfɪkənt/
- Sufficiently great or important.
-
Persistent (adj)
- /pəˈsɪstənt/
- Continuing firmly or obstinately in a course of action.
Conclusion
Understanding trends in data, logical structuring, and appropriate vocabulary usage are vital for excelling in IELT Writing Task 1. Consistent practice and careful analysis, as shown here with the topic of “Average Household Spending on Food and Drink (2000-2023),” will significantly enhance your performance and help you target a Band 7 or higher.