The IELTS Writing Task 1 often requires candidates to describe and analyze trends represented in various forms of data, such as line graphs, bar charts, tables, or pie charts. One recurrent topic is the trends in household waste recycling, which is crucial for understanding environmental conservation efforts and public awareness over time. In this article, we’ll explore the trends in household waste recycling from 2000 to 2023, providing detailed analysis and valuable tips for IELTS candidates.
Understanding the Task
To kick things off, let’s briefly review the typical IELTS Writing Task 1 question related to household waste recycling trends. The task might present a graph showing the amount of household waste recycled over a specific period, and candidates need to summarize the key features, make comparisons, and report significant trends.
Sample Task
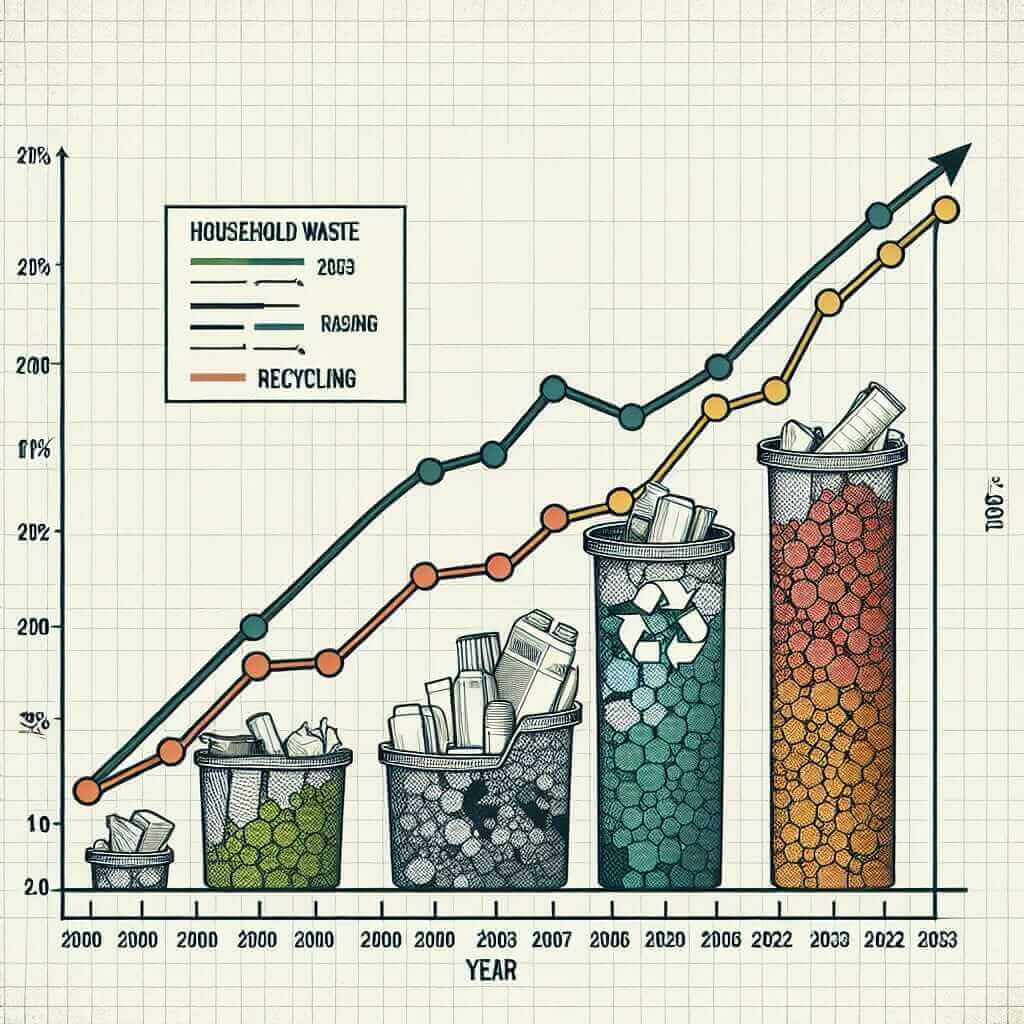
Task: The graph below shows the trends in household waste recycling in three different countries from 2000 to 2023. Summarize the information by selecting and reporting the main features and make comparisons where relevant.

Analysis of the Sample Task
Before writing a response, it’s imperative to understand the data presented in the graph. Here is a hypothetical data set corresponding to the given task:
| Year | Country A | Country B | Country C |
|---|---|---|---|
| 2000 | 15% | 25% | 10% |
| 2005 | 25% | 30% | 15% |
| 2010 | 35% | 45% | 20% |
| 2015 | 45% | 50% | 30% |
| 2020 | 55% | 60% | 40% |
| 2023 | 65% | 70% | 50% |
Writing a Band 7+ Response
Introduction
Start by paraphrasing the task description:
“The line graph illustrates the recycling rates of household waste in three different countries over the period from 2000 to 2023.”
Overview
Provide an overview of the main trends without details:
“Overall, all three countries showed an upward trend in household waste recycling. Country B consistently had the highest recycling rates, whereas Country C exhibited the slowest growth throughout the period.”
Detailed Analysis
Describe the main features and provide specific data from the graph:
“In 2000, Country B had the highest recycling rate at 25%, followed by Country A at 15%, and Country C at 10%. Over the next five years, the recycling rates gradually increased in all three countries, with Country B reaching 30% in 2005. By 2010, Country B had surged to 45%, while Country A and Country C improved to 35% and 20% respectively.
From 2010 to 2020, Country B continued to lead, peaking at 60% in 2020. During the same period, Country A and Country C also experienced significant growth, with rates of 55% and 40%. By 2023, all countries saw substantial increases, with Country B at 70%, Country A at 65%, and Country C at 50%, showing a convergence in recycling rates towards the end of the period.”
Conclusion
Summarize key points:
“In summary, the data demonstrates a notable upward trend in household waste recycling across all three countries, with the most rapid acceleration observed in Country B. Despite starting with lower rates, Countries A and C made remarkable progress over the analyzed period.”
Word Count
The word count for this sample response is 213.
Important Writing Tips
Vocabulary
- “Upward trend” – refers to an increase.
- “Recycling rates” – the percentage of waste being recycled.
- “Gradually increased” – slow and steady rise.
- “Surged” – a rapid increase.
- “Significant growth” – noticeable rise.
- “Substantial increases” – considerable rise.
- “Notable upward trend” – clear rising trend.
- “Convergence” – coming closer together.
Grammar
- Use the past tense to describe data in previous years: “Country B had the highest recycling rate.”
- Linking words: Use connectors like “while,” “whereas,” and “during” to compare and contrast data.
- Passive voice can be useful: “By 2020, significant growth was observed.”
Common Pitfalls
- Avoid copying the task description. Always paraphrase.
- Do not include or assume information not given in the graph.
- Maintain a clear structure: Introduction, Overview, Details, Conclusion.
- Use a range of vocabulary and grammatical structures.
Conclusion
Understanding the trends in household waste recycling is not only relevant for environmental studies but also resembles a common task in IELTS Writing Task 1. By accurately analyzing data, using relevant vocabulary, and maintaining clarity in structure, candidates can aim for a high band score. Remember, practice is key to mastering this skill.
For ongoing practice, consider exploring more graphs and data sets, and try describing them using the techniques and vocabulary discussed here. Happy learning and best of luck with your IELTS preparation!