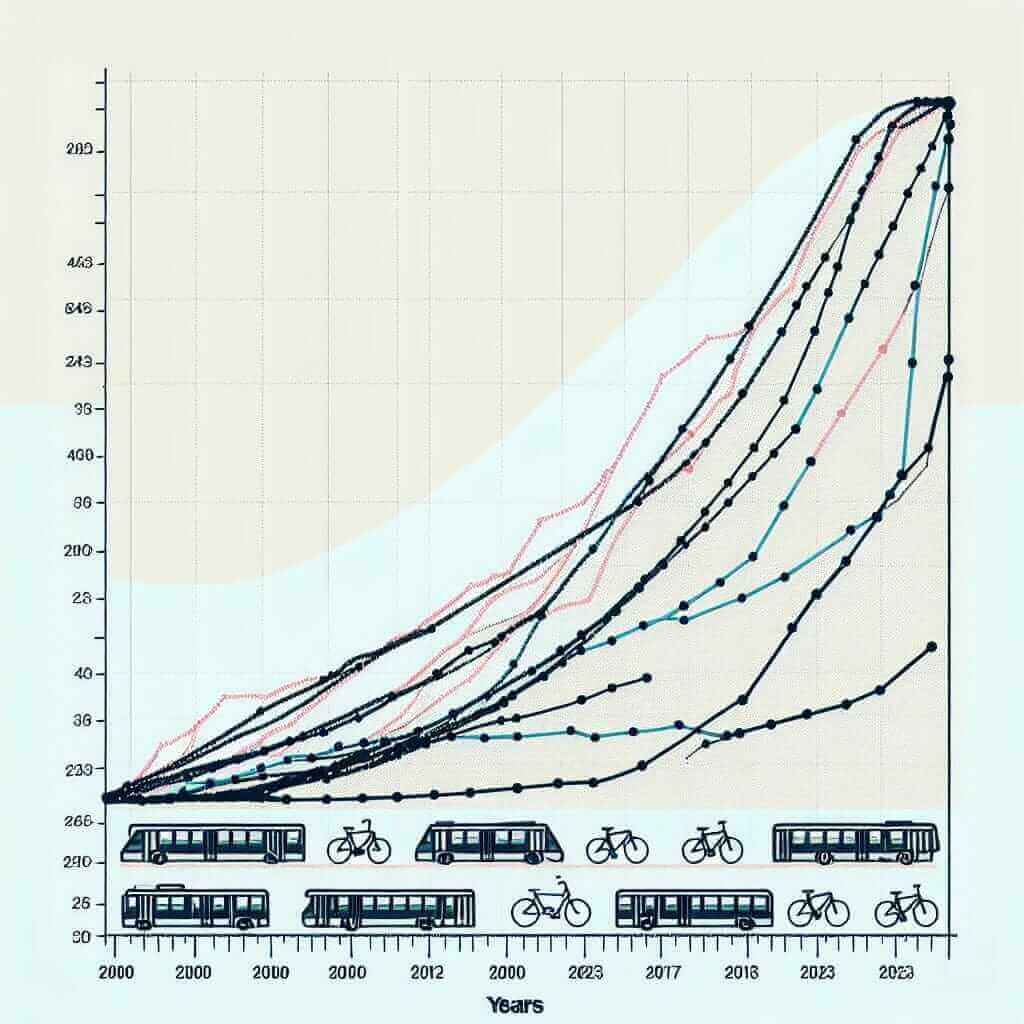
The usage of different types of public transport has been a popular topic in the IELTS Writing Task 1. This task often requires candidates to describe trends or explain the variations in data provided through charts, graphs, or tables. In today’s lesson, we will delve into the usage of various types of public transport from 2000 to 2023.
Common IELTS Writing Task 1 Prompts
In the context of public transport usage, several common IELTS prompts include:
- Line Graph showing trends over a period.
- Bar Chart comparing different types of public transport over various years.
- Table summarizing the percentage change in usage.
Here are some possible examples related to this topic:
- The line graph below shows the number of passengers using different types of public transport in a particular city between 2000 and 2023.
- The bar chart compares the popularity of different public transport options from 2000 to 2023 in three countries.
- The table provides data about the percentage change in the use of various public transport methods over the period from 2000 to 2023.
For today’s lesson, let’s choose the first example and create a detailed writing sample.
Creating the Data (Line Graph Example)

Analyzing the Prompt
The line graph illustrates the number of passengers using buses, trains, bicycles, and trams in a specific city from 2000 to 2023. Below, we will write a sample response that describes the data accurately and systematically.
Sample Writing Task 1 Response
Introduction
The line graph provides information about the number of passengers who utilized four types of public transport (buses, trains, bicycles, and trams) in a particular city over a 23-year period, from 2000 to 2023.
Overall Trend
Overall, the usage of all four types of public transport exhibited an upward trend throughout the given period. Buses consistently had the highest number of passengers, whereas trams had the lowest.
Detailed Breakdown
In 2000, buses were the most popular mode of transportation, with 100,000 passengers. This figure rose steadily to 210,000 by 2023. Trains, starting at 80,000 passengers, also saw a gradual increase, reaching 150,000 passengers by the end of the period.
The number of bicycle users was initially lower at 50,000 in 2000. However, it experienced significant growth, peaking at 100,000 passengers in 2023. Trams, although having the least number of passengers, displayed a similar pattern. Starting at 30,000 passengers in 2000, the number climbed consistently to 70,000 by 2023.
Conclusion
In conclusion, while all types of public transport showed an increase in passenger numbers from 2000 to 2023, buses remained the most widely used transport mode. Trains and bicycles also gained popularity, whereas trams had the unique distinction of having the least yet steadily growing passenger count.
Word Count: 193
Key Considerations for Writing
Vocabulary and Phrasal Variations
- Gradual Increase: “The usage of buses increased gradually over the period.”
- Steady Rise: “There was a steady rise in the number of train passengers.”
- Peak: “Bicycle usage peaked at 100,000 passengers in 2023.”
- Significant Growth: “Bicycles experienced significant growth over the 23-year period.”
- Consistently: “The number of tram passengers increased consistently each year.”
Important Vocabulary
- Illustrates (verb) /ɪˈlʌstreɪts/: The graph illustrates the trends in public transport usage.
- Exhibits (verb) /ɪɡˈzɪbɪts/: The usage data exhibits a clear upward trend.
- Gradual (adjective) /ˈɡrædʒuəl/: A gradual increase implies slow but steady progress.
- Steadily (adverb) /ˈstedəli/: Passenger numbers grew steadily over the period.
- Trend (noun) /trɛnd/: The overall trend indicates an increase in public transport usage.
- Consistent (adjective) /kənˈsɪstənt/: There was a consistent rise in the number of passengers.
- Peak (verb/noun) /piːk/: Bicycle usage peaked at 100,000 passengers.
- Popular (adjective) /ˈpɒpjʊlər/: Buses remained the most popular mode of transport.
- Percentage (noun) /pəˈsɛntɪdʒ/: The table shows the percentage change in usage.
- Passenger (noun) /ˈpæsɪndʒə/: The graph shows the number of passengers using public transport.
Conclusion
When writing about trends in public transport usage for the IELTS Writing Task 1, it is crucial to provide a clear and systematic description of the data. Use a variety of vocabulary and grammatical structures to enhance your writing. Moreover, ensure accurate usage of words and maintain a formal tone throughout the response to aim for a Band 7+ score.