The topic “Global Smartphone Sales (2010-2023)” presents an excellent opportunity for IELTS candidates to practice their skills in Writing Task 1, which involves summarizing, reporting, and making comparisons based on visual data. This guide will provide a comprehensive breakdown of how to approach this topic, accompanied by a sample task, analysis, and detailed writing tips.
Global smartphone sales data is frequently used in IELTS Writing Task 1 because it incorporates trends, comparisons, and significant figures—an excellent practice that mirrors the demands of the test. Here are three typical task questions you might encounter:
- “The graph below shows the global sales of smartphones from 2010 to 2023. Summarize the information by selecting and reporting the main features, and make comparisons where relevant.”
- “The table below depicts the global market share of different smartphone brands from 2010 to 2023. Summarize the information by selecting and reporting the main features, and make comparisons where relevant.”
- “The chart below illustrates the annual revenue generated from global smartphone sales between 2010 and 2023. Summarize the information by selecting and reporting the main features, and make comparisons where relevant.”
Sample Task
Let’s choose the first sample task for detailed analysis and writing:
“The graph below shows the global sales of smartphones from 2010 to 2023. Summarize the information by selecting and reporting the main features, and make comparisons where relevant.”
Real-world Data and Chart Creation
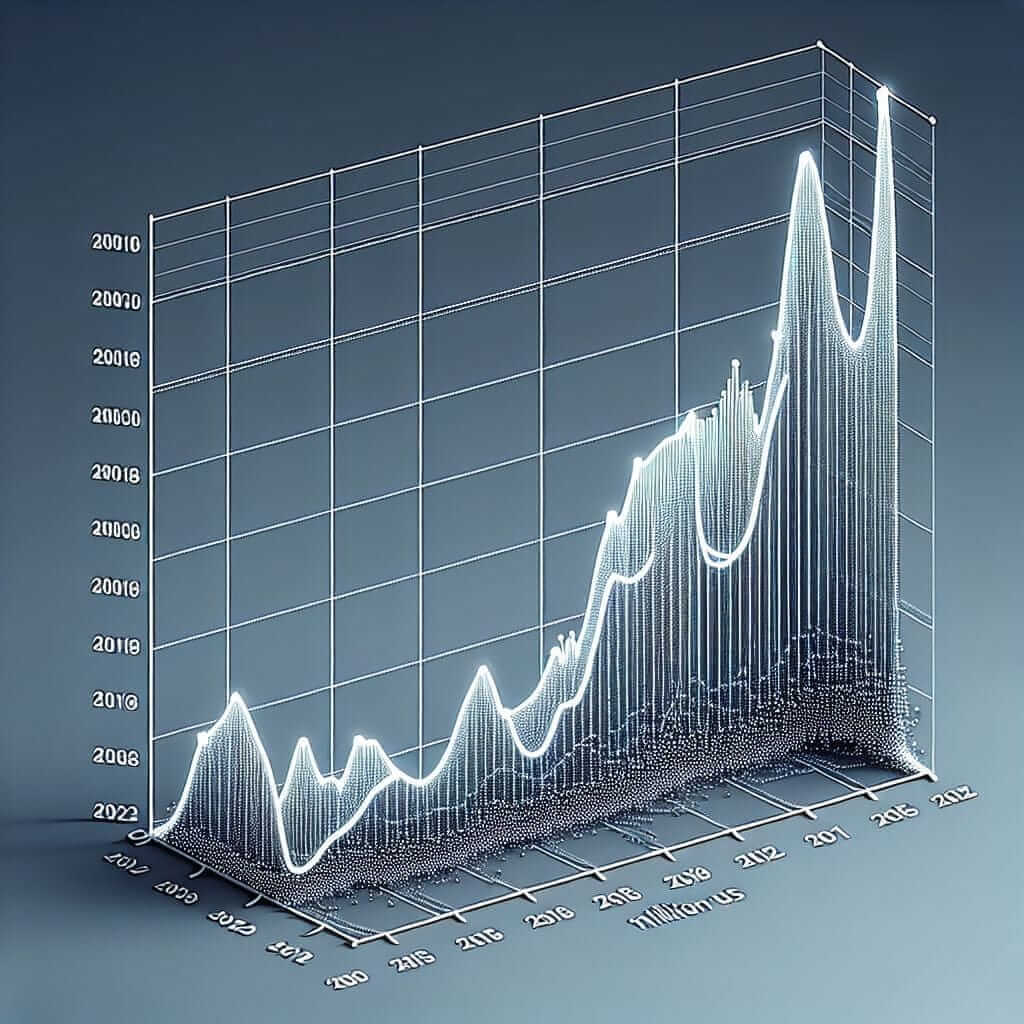
To illustrate this task, we create a hypothetical line graph based on trends typically observed in global smartphone sales. This graph includes data points showing the sales figures (in millions) across the given years.

The graph indicates a steady increase in smartphone sales from 2010 to 2023 with notable peaks and troughs. For instance, sales surged between 2014 and 2018 before plateauing and then slightly declining from 2019 onwards.
Analyzing the Task
Identifying Key Features
- Overall trend: General increase followed by stability and a slight decline.
- Peaks and troughs: Notable surges and drops in sales at specific intervals.
- Comparisons: Annual changes and cumulative comparisons over multi-year periods.
Sample Answer
The graph illustrates the global sales of smartphones from 2010 to 2023. Overall, there is a marked increase in sales over the period, with fluctuations at various points.
In 2010, global smartphone sales stood at approximately 200 million units. This figure rose steadily, reaching around 400 million units by 2013. Following this, an accelerated growth phase was observed, with sales peaking at roughly 800 million units in 2018.
However, from 2019 onwards, the sales figures plateaued, maintaining an annual average of 850 million units until 2020. Subsequently, a slight decline was noted, with sales dropping to about 800 million units by 2023.
This data suggests that while the global appetite for smartphones grew significantly during the early 2010s, market saturation and other factors may have contributed to the recent leveling off and subsequent decline in sales.
(Word count: 145)
Tips for Writing
-
Vocabulary and Phrases
- Use varied vocabulary to describe trends: “increase,” “rise,” “surge,” “peak,” “plateau,” “decline,” etc.
- Descriptive language for comparisons: “significant,” “substantial,” “steady,” “notable.”
-
Grammar Structures
- Utilize comparatives and superlatives effectively: “greater than,” “the highest,” “lower than.”
- Employ complex sentences to discuss trends: “While sales rose steadily until 2018, a subsequent decline was observed from 2019 onwards.”
Vocabulary to Remember
- Fluctuation (n) /ˌflʌk.tjuːˈeɪ.ʃən/: Variation; rise and fall irregularly in number or amount.
- Plateau (v/n) /plæˈtoʊ/: To reach a state of little or no change after a time of activity or progress.
- Surge (v/n) /sɝːdʒ/: A sudden powerful forward or upward movement.
- Peak (n/v) /piːk/: Reach the highest point.
- Stability (n) /stəˈbɪl.ə.ti/: The state of being stable; firmness in position.
Conclusion
To achieve a high score in IELTS Writing Task 1, particularly for topics like global smartphone sales, it’s crucial to accurately describe data trends, make relevant comparisons, and employ a variety of grammatical structures. Understanding how to effectively summarize and interpret visual information will significantly improve your performance, aiming for Band 7+.
Remember, practicing with real-world data and staying updated with global trends can provide insightful details and develop proficiency in handling such tasks. Happy studying!