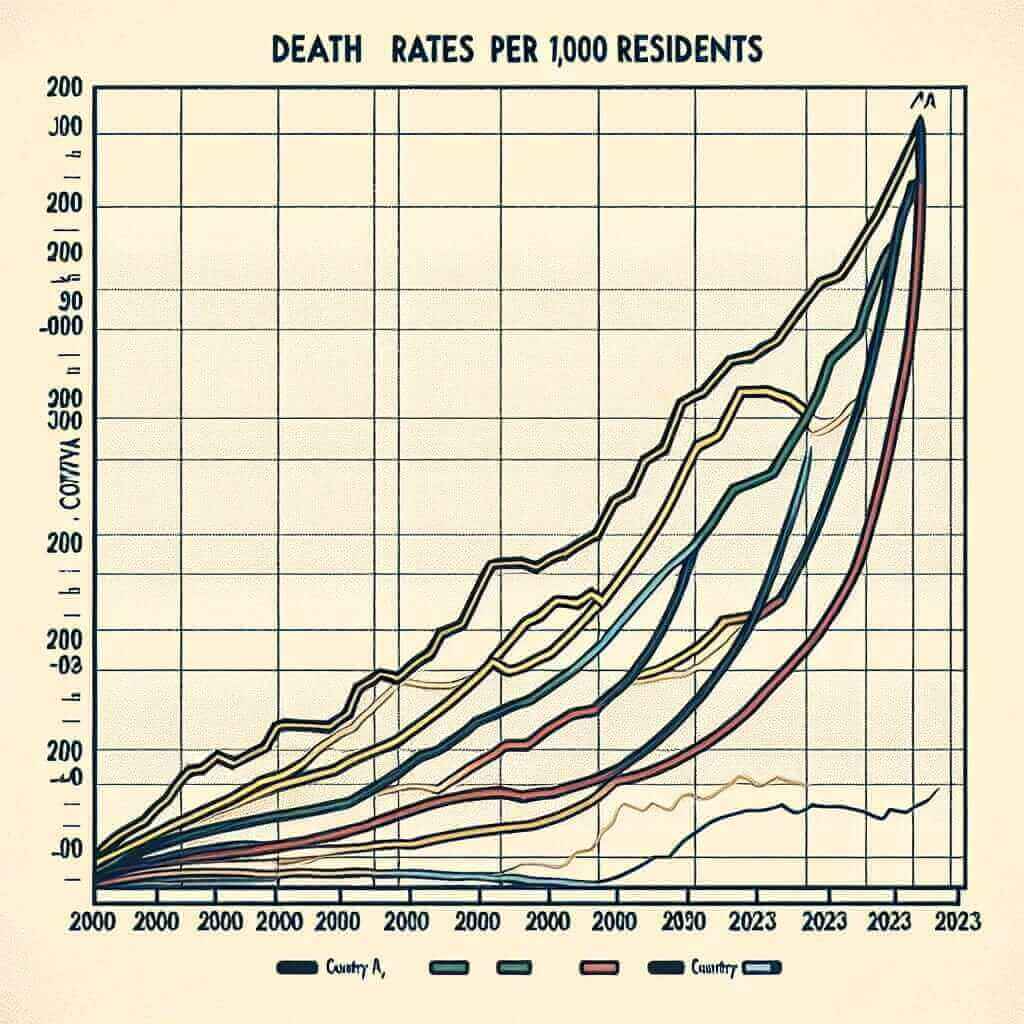
In the IELTS Writing Task 1, candidates are often required to describe and analyze data presented in various formats, such as tables, charts, and graphs. One common topic is the comparison of death rates among different countries over a period. This type of task tests your ability to interpret and compare quantitative data accurately.
Given the widespread interest and relevance of tracking global health trends, this topic frequently appears in IELTS exams. In this article, we will explore how to approach such a task, analyze a sample question, and provide a model answer to guide your preparation.
Sample Task Description
You should spend about 20 minutes on this task.
The table below shows the death rates per 1,000 people in four different countries (Country A, Country B, Country C, and Country D) from the year 2000 to 2023.
Summarize the information by selecting and reporting the main features, and make comparisons where relevant.
Table: Death Rates per 1,000 People (2000-2023)
| Year | Country A | Country B | Country C | Country D |
|---|---|---|---|---|
| 2000 | 9.5 | 8.2 | 7.4 | 6.1 |
| 2005 | 10.1 | 8.0 | 7.2 | 5.9 |
| 2010 | 10.3 | 8.1 | 7.5 | 6.0 |
| 2015 | 10.7 | 8.3 | 7.7 | 6.2 |
| 2020 | 11.0 | 8.5 | 7.9 | 6.4 |
| 2023 | 11.4 | 8.7 | 8.1 | 6.5 |
Write at least 150 words.
Analyzing the Task
First, examine the data provided in the table:
- Trend Analysis: Identify any noticeable trends in the death rates over the years for each country.
- Comparison: Compare the death rates between the countries for each year.
- Key Features: Highlight significant changes, such as sharp increases or decreases.

Model Answer
The table summarizes the death rates per 1,000 people in four countries (Country A, Country B, Country C, and Country D) from 2000 to 2023.
Overall, Country A experienced a consistent increase in its death rate over the period, rising from 9.5 in 2000 to 11.4 in 2023. This represents a steady climb each recorded year. In contrast, Country D had the lowest death rates throughout the years, albeit with a slight gradual increase from 6.1 in 2000 to 6.5 in 2023.
Country B’s death rate remained relatively stable, fluctuating mildly from 8.2 in 2000 to 8.7 in 2023. Meanwhile, Country C observed a modest rise over the years, starting at 7.4 in 2000 and increasing to 8.1 by 2023. There was an observable period of fluctuation in Country C’s rates around 2010 but it stabilized later on.
The most significant change was observed in Country A, where the death rate rose by almost 2 units over the 23 years, indicating a potential increase in population size or deterioration in health services. In contrast, the changes in the other countries were less dramatic.
In summary, while all four countries experience increases in death rates over the period, Country A stands out with the highest and most consistent rise, suggesting unique factors influencing its health trends.
Word Count: 209
Tips for Writing High-Scoring Task 1 Responses
Key Vocabulary and Grammar
Vocabulary
- Consistent Increase (noun phrase) – a steady rise over time
- Fluctuating (verb) – varying irregularly
- Gradual Increase (noun phrase) – a slow rise over time
- Noticeable Trends (noun phrase) – clear patterns over time
- Sharp Increase (noun phrase) – a rapid rise
Grammar Structures
- Comparative and Superlative Forms: Use comparisons effectively, such as “higher than,” “the most significant increase,” etc.
- Time Clues: Utilize phrases like “over the period,” “from 2000 to 2023,” “by 2023,” etc.
- Summarizing and Synthesizing: Begin with overall trends before delving into specific details.
Important Notes
- Overview First: Always start with a general summary of the main trends and overall comparison.
- Data Accuracy: Make sure you compare data accurately and use the correct figures.
- Word Count Management: Ensure your response is at least 150 words long to meet the task requirements. Avoid overly verbose descriptions; be concise and to the point.
Conclusion
When tackling a task involving the comparison of death rates among various countries, it is crucial to present an organized and accurate summary of the data. Start by identifying key trends, comparing the figures, and highlighting significant changes. Use appropriate vocabulary and grammar to articulate your observations clearly. By following these guidelines, you can aim for a high band score in the IELTS Writing Task 1.
By adhering to these principles, you can develop a well-rounded and coherent response to similar prompts and excel in your IELTS examination.