The IELTS Writing Task 1 often includes complex data representation in the form of graphs, tables, and charts. Mastery of this task is crucial for achieving a high band score in the IELTS exam. In this lesson, we will explore how to discuss average daily calorie intake in various countries between 2000 and 2023, an excellent practice topic for Task 1.
Suggested IELTS Writing Task 1 Prompts:
Prompt 1: “The graph below shows the average daily calorie intake in various countries from 2000 to 2023. Summarize the information by selecting and reporting the main features, and make comparisons where relevant.”
Prompt 2: “The table below displays the average daily calorie intake in different countries between 2000 and 2023. Summarize the information by selecting and reporting the main features, and make comparisons where necessary.”
Example Prompt to Practice:
Let’s take the first prompt as our focus:
Prompt: “The graph below shows the average daily calorie intake in various countries from 2000 to 2023. Summarize the information by selecting and reporting the main features, and make comparisons where relevant.”
Graph/Data Description:
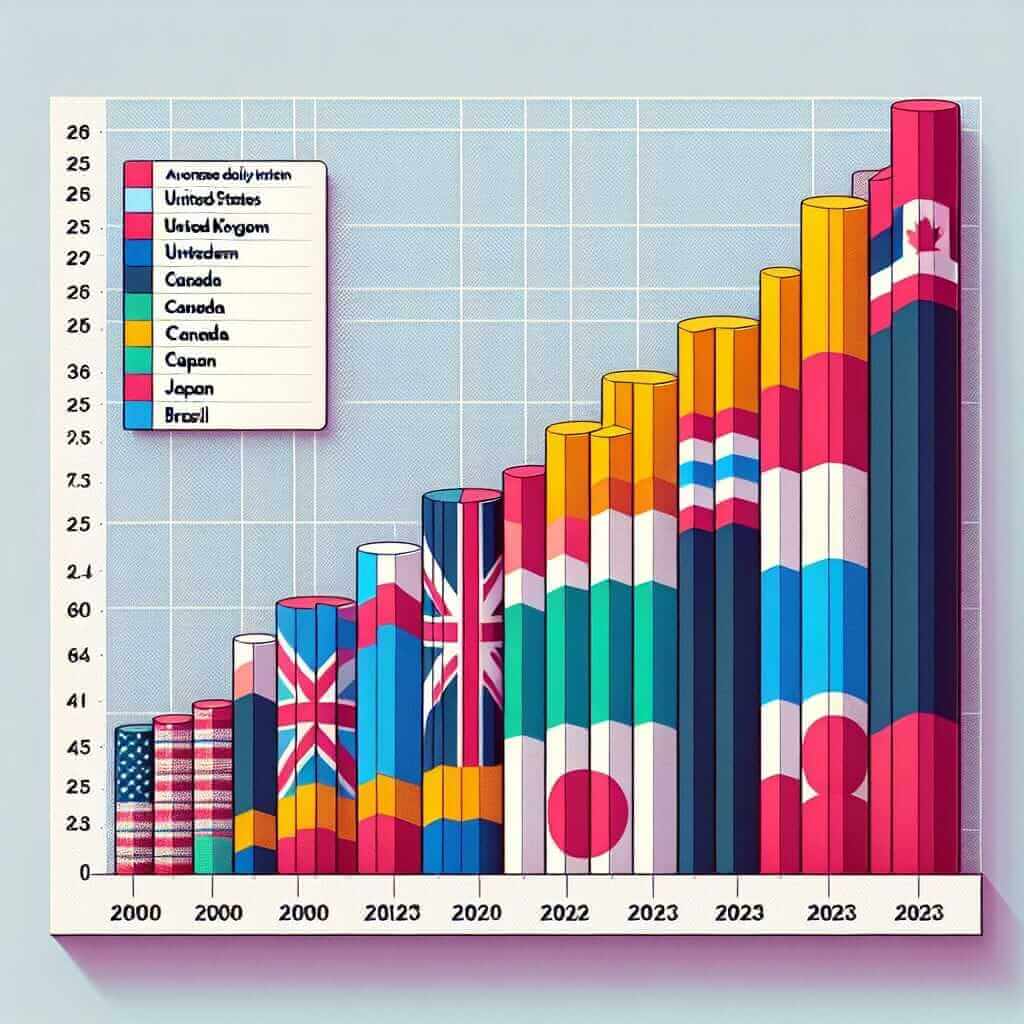
For the purpose of this practice, let’s consider a hypothetical bar graph showing the average daily calorie intake in the following countries over the specified period:
- USA: 2200 to 2700 calories
- UK: 2100 to 2500 calories
- Canada: 2000 to 2400 calories
- Japan: 1800 to 2200 calories
- Brazil: 1600 to 2000 calories

Analysis of the Prompt:
- Identify Key Information: The task is to summarize and compare the average daily calorie intake across different countries.
- Trend Identification: Look for general trends, such as increase, decrease or stability in calorie intake.
- Making Comparisons: Highlight significant similarities and differences between the countries over the given period.
Sample Answer:
The bar graph illustrates the average daily calorie intake per person in five different countries from 2000 to 2023. Overall, there is an upward trend in calorie consumption across all the countries, with the USA consistently showing the highest intake and Brazil the lowest.
In 2000, the average daily calorie intake in the USA was approximately 2200 calories, which gradually increased to about 2700 calories by 2023. The UK followed a similar pattern, starting at 2100 calories and rising to nearly 2500 calories. Canada also experienced an increase from 2000 to 2400 calories during this period.
Japan’s calorie intake, initially one of the lowest at around 1800 calories in 2000, saw a significant rise to 2200 calories by 2023. Similarly, Brazil reported the least calorie consumption, beginning at 1600 calories in 2000 but eventually reaching 2000 calories in 2023.
In comparison, the USA consistently had the highest calorie intake throughout the period, with a peak of 2700 calories. On the other hand, Brazil, despite showing an increase, remained the country with the lowest daily calorie consumption.
Finally, the overall trend indicates a gradual increase in daily calorie intakes in these countries, highlighting a possible rise in living standards or changing dietary habits. This data suggests that calorie consumption worldwide is becoming more homogeneous, with less pronounced differences among these nations over time.
Word Count: 207
Key Tips for Writing:
- Paraphrasing the Task Prompt: Use synonyms and change sentence structure to avoid repetition.
- Present, Compare and Contrast: Clearly present the data while making relevant comparisons.
- Highlight Key Trends: Identify and describe the main trends or changes over the given period.
- Cohesion and Coherence: Ensure a logical structure and clear progression of ideas.
Important Vocabulary:
- Calorie intake (n) /ˈkæləri ˈɪnteɪk/: The amount of calories consumed.
- Consumption (n) /kənˈsʌmpʃən/: The act of consuming food or calories.
- Upward trend (n) /ˈʌpwərd trɛnd/: An increase over time.
- Gradual (adj) /ˈɡrædʒuəl/: Moving or changing slowly.
- Peak (v, n) /piːk/: To reach the highest point.
- Homogeneous (adj) /ˌhəʊməˈdʒiːniəs/: Of the same kind or nature; similar.
- Dietary habits (n) /ˈdaɪətəri ˈhæbɪts/: The routine eating patterns of an individual or population.
Mastering these elements and incorporating relevant data accurately will help you achieve a higher score in the IELTS Writing Task 1.
Conclusion:
To effectively write about data representation in IELTS Writing Task 1, focus on identifying key trends, making relevant comparisons, and using cohesive language. This approach is beneficial not only for handling topics like average daily calorie intake but also for other data-driven prompts. By practicing these strategies, you can improve your writing skills and aim for a higher band score in the exam.