Understanding expenditure trends over time is an integral skill tested in IELTS Writing Task 1. In this article, we will explore how to describe trends in household expenditure using real-world data from 2000 to 2023, including specific vocabulary and grammatical structures to enhance your writing.
Introduction
Household expenditure trends have been a popular subject in IELTS Writing Task 1, as they offer valuable insights into the changing priorities and economic conditions of different eras. Over the years, these trends reflect shifts in consumer behavior, technological advancements, and socio-economic changes.
Let’s consider some sample questions related to this topic:
-
Sample Question 1: The graph below shows changes in household spending in various categories from 2000 to 2023. Summarize the information by selecting and reporting the main features, and make comparisons where relevant.
-
Sample Question 2: The table below illustrates the household expenditure on select items in five countries between 2000 and 2023. Summarize the information by selecting and reporting the main features, and make comparisons where relevant.
-
Sample Question 3: The pie charts compare the distribution of household spending in 2000 and 2023. Summarize the information by selecting and reporting the main features, and make comparisons where relevant.
Choosing a Sample Question for Analysis
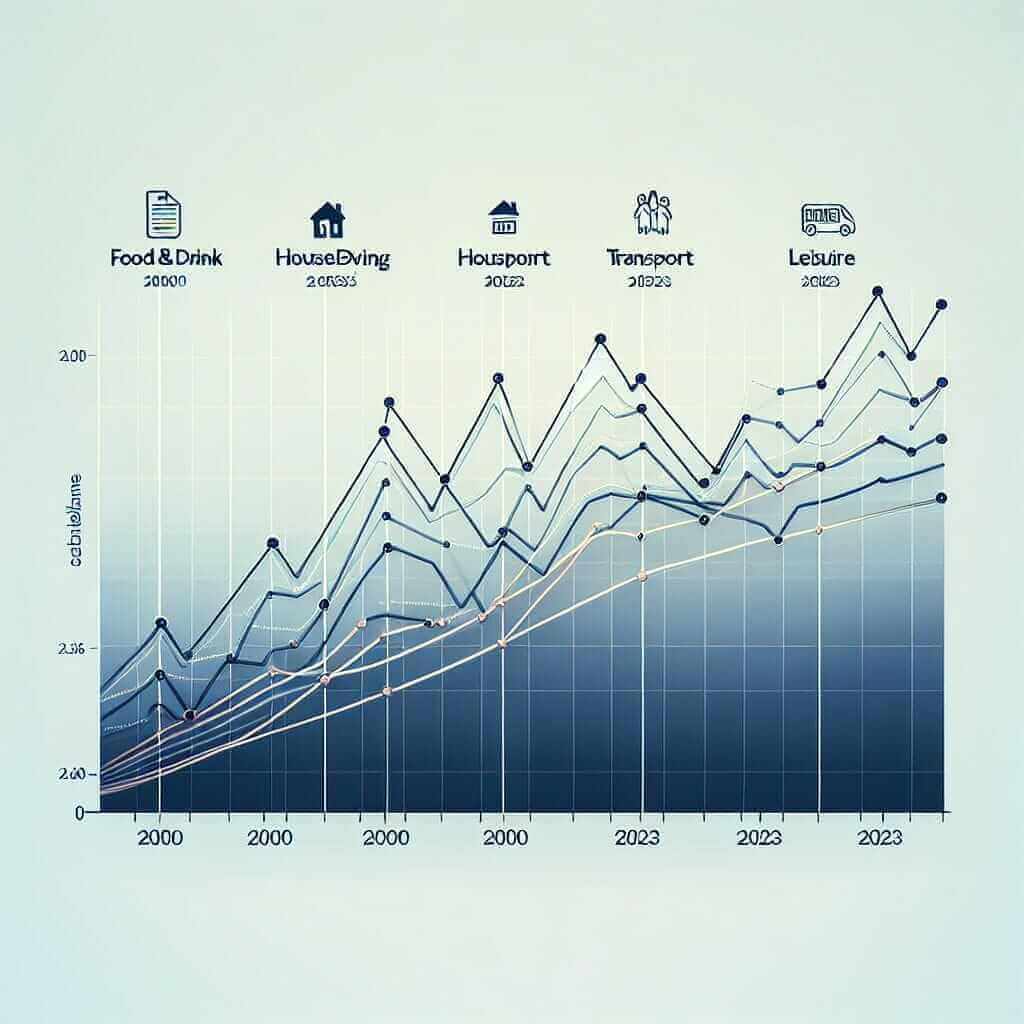
For this lesson, we will focus on Sample Question 1, which involves a line graph illustrating changes in household spending categories from 2000 to 2023.
Data and Graph Creation
Based on trends in household expenditure, let’s visualize the following data:
| Year | Food & Drink | Housing | Transport | Leisure |
|---|---|---|---|---|
| 2000 | 25% | 30% | 15% | 30% |
| 2005 | 23% | 32% | 17% | 28% |
| 2010 | 20% | 34% | 20% | 26% |
| 2015 | 18% | 35% | 22% | 25% |
| 2020 | 17% | 36% | 24% | 23% |
| 2023 | 16% | 38% | 25% | 21% |
To visualize this data, imagine a line graph where the horizontal axis represents the years (2000-2023) and the vertical axis represents the percentage of expenditure. Each category (Food & Drink, Housing, Transport, Leisure) is represented by a different line color or style.

Analyzing the Sample Question
Task: Summarize the information by selecting and reporting the main features, and make comparisons where relevant.
Key Features Identification:
- Identify the overall trends for each category.
- Note any significant increases or decreases.
- Compare the percentages between the categories at different points in time.
Trends:
- Overall, spending on Housing consistently increased from 30% in 2000 to 38% in 2023.
- Expenditure on Food & Drink showed a declining trend, from 25% in 2000 to 16% in 2023.
- Transport spending gradually increased from 15% in 2000 to 25% in 2023.
- Leisure spending decreased from 30% in 2000 to 21% in 2023.
Sample Writing
Introduction:
The provided line graph illustrates the changes in household expenditure across four categories—Food & Drink, Housing, Transport, and Leisure—from 2000 to 2023.
Overview:
Overall, there was a noticeable upward trend in housing and transport expenditures, whereas spending on food and drink, as well as leisure, experienced significant declines over the given period.
Detailed Description:
In 2000, households allocated the largest portion of their spending to housing at 30%, followed closely by leisure at 30%, food and drink at 25%, and transport at 15%. By 2023, the allocation for housing rose sharply to 38%, marking the highest expenditure category. Transport spending also saw a steady increase, peaking at 25% in 2023. Conversely, expenditure on food and drink declined from 25% to 16% over the same period. Leisure spending gradually decreased from 30% to 21%.
Analysis and Comparison:
The most significant growth occurred in housing, reflecting rising living costs and possibly increased investments in real estate. Transport expenditure rose, likely due to increased vehicle ownership and fuel prices. Meanwhile, reduced spending on food and drink and leisure suggests a shift in priorities or improved efficiency in these areas.
Word Count: 193
Writing Tips
-
Vocabulary:
- Expenditure (n) [ɪkˈspɛndɪtʃə]: The amount of money spent.
- Allocate (v) [ˈæləkeɪt]: To distribute resources or duties for a specific purpose.
- Decline (v/n) [dɪˈklaɪn]: Decrease.
- Category (n) [ˈkætəgəri]: A group or class of items with similar characteristics.
- Trend (n) [trɛnd]: A general direction in which something is developing or changing.
-
Grammar:
- Use the past tense to describe data points from previous years.
- Employ comparative forms (e.g., more than, less than) to highlight differences.
- Use adverbials (e.g., overall, notably) to summarize and transition between points.
Vocabulary to Remember
- Expenditure (n) [ɪkˈspɛndɪtʃə]: The amount of money spent.
- Allocate (v) [ˈæləkeɪt]: To distribute for a specific purpose.
- Decline (v/n) [dɪˈklaɪn]: A decrease or reduction.
- Category (n) [ˈkætəgəri]: A class or division of people or things regarded as having particular shared characteristics.
- Trend (n) [trɛnd]: A general direction in which something is developing or changing.
- Significant (adj) [sɪɡˈnɪfɪkənt]: Sufficiently great or important to be worthy of attention.
- Rise (v) [raɪz]: To increase in quantity or value.
- Decrease (v) [dɪˈkriːs]: To become smaller or less in size, amount, intensity, or degree.
- Notable (adj) [ˈnəʊtəbl]: Worthy of attention or notice; remarkable.
- Expenditure (n) [ɪkˈspɛndɪtʃə]: The act of spending funds.
Conclusion
In Writing Task 1 of the IELTS exam, describing trends in household expenditure requires clear identification of key features and effective comparison. Using relevant vocabulary and accurate grammar, as demonstrated in this article, can help you achieve a high band score. Practice with various data presentations, and refine your ability to summarize and analyze information to excel in your IELTS Writing Task 1.