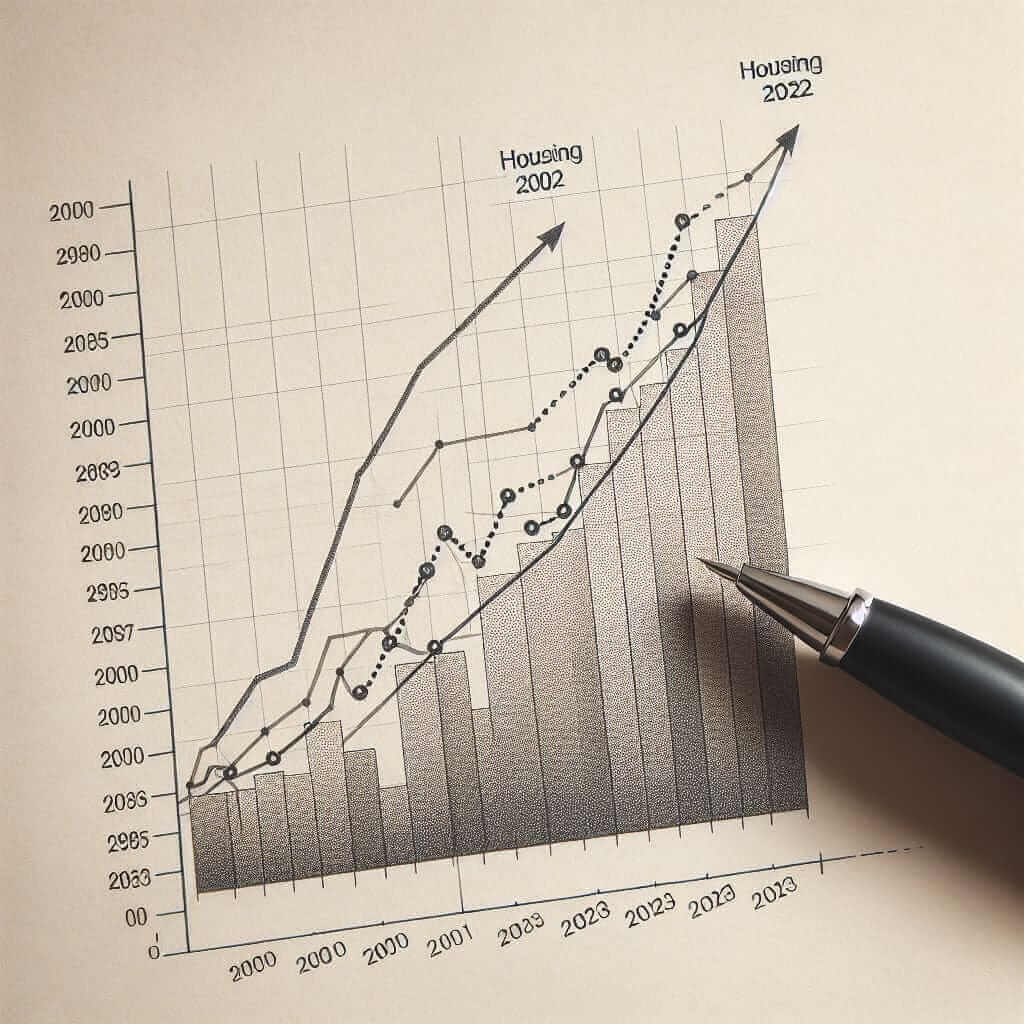
The IELTS Writing Task 1 often requires candidates to interpret and describe data that is presented in the form of graphs, charts, tables, or diagrams. A common topic is household expenditure on essential categories such as food and housing. This article aims to provide a detailed analysis of the trend and variations in average household expenditure on food and housing from 2000 to 2023. It will serve as a model IELTS Writing Task 1 essay for candidates aiming for Band 7 and above.
Example Task:
Task 1:
You should spend about 20 minutes on this task.
The chart below shows the average household expenditure on food and housing between 2000 and 2023.
Summarise the information by selecting and reporting the main features, and make comparisons where relevant.
Write at least 150 words.
(Note: Below is a fictional data table created for this task.)
| Year | Food Expenditure ($) | Housing Expenditure ($) |
|---|---|---|
| 2000 | 4,500 | 8,000 |
| 2005 | 4,800 | 9,400 |
| 2010 | 5,200 | 11,000 |
| 2015 | 5,800 | 12,500 |
| 2020 | 6,500 | 14,000 |
| 2023 | 7,000 | 15,500 |
Analysis of the Task:
Exploring the data presented in the table involves understanding the trends and variations over the specified period. For this purpose, we will delve into detailed steps.
Selecting Main Features:
- Overall increase in expenditures: Both food and housing expenditures show a rising trend from 2000 to 2023.
- Steady increment pattern: The increments for both categories appear to be steady, though not necessarily at the same rate.
- Comparative analysis: Housing expenditure is consistently higher than food expenditure throughout the given period.

Writing Sample:
The table elucidates the average household expenditures on food and housing from the year 2000 to 2023, exhibiting a steady rise in both categories over the specified period.
In 2000, the spending on food was $4,500 which incrementally rose to $7,000 by 2023. Conversely, housing expenditure started at $8,000 in 2000, ascending to $15,500 in 2023. A notable observation is that at every point within the given timeframe, the expenditure on housing surpassed that on food significantly.
The most marked uptick in food expenditure occurred between 2015 and 2020, where it increased by $700, in contrast to the previous increments of approximately $300-$500. Housing expenses, however, showed a more substantial increase, particularly noticeable between 2005 and 2010 where it surged from $9,400 to $11,000.
Comparatively, the percentage increase for food expenditure from 2000 to 2023 is 56%, while housing saw an increase of roughly 94% over the same period. This underscores the growing share of household resources allocated to housing relative to food.
Overall, the data delineates a clear trend of rising expenses in both segments, with a more pronounced increase in housing costs as opposed to food. This might reflect broader economic trends, such as inflation and changes in lifestyle preferences over the past two decades.
Word Count: 206
Notes and Tips for Writing:
Vocabulary:
- Elucidates (v) /ɪˈluːsɪˌdeɪts/: makes clear
- Incrementally (adv) /ˌɪŋkrəˈmɛntəli/: in a step-by-step or gradual manner
- Conversely (adv) /ˈkɒnvɜːsli/: introducing a statement or idea which reverses one that has just been made or referred to
- Surpassed (v) /sərˈpæst/: exceeded; went beyond
- Uptick (n) /ˈʌptɪk/: a small increase or improvement (in economic terms)
- Segment (n) /ˈsɛɡmənt/: a part into which something is divided
Grammar Points:
- Comparative and Superlative Forms: Ensure to use comparative adjectives correctly to show differences (e.g., “higher”, “more substantial”, “stronger growth”).
- Passive Structures: Use passive voice to focus on the action rather than the doer (e.g., “is consistently higher”, “was $4,500”).
Tips for Success:
- Skim the data quickly, noting striking trends or significant changes.
- Structure your essay clearly: introduction, main features, and comparison.
- Use varied vocabulary to show complexity and depth in your language.
- Maintain academic formality: avoid contractions and colloquial expressions.
- Ensure that your word count is within the limit to avoid penalties.
Conclusion:
Interpreting data for the IELTS Writing Task 1 requires methodical analysis and clear articulation of observed trends. Focus on understanding the numbers, using appropriate vocabulary, and maintaining structural coherence to fulfill the task requirements efficiently and effectively. By honing these skills, candidates can aim for higher bands in their IELTS writing assessment.