When preparing for the IELTS Writing Task 1, understanding trends and variations in data is crucial. One frequently encountered topic is comparing levels of access to education in different countries over a specified period. This type of task assesses your ability to interpret and clearly present data. In this article, we will analyze the trends in access to education from 2000 to 2023 across various countries. We will also provide useful vocabulary, grammatical structures, and a sample response to help you aim for a high Band score.
Sample Task
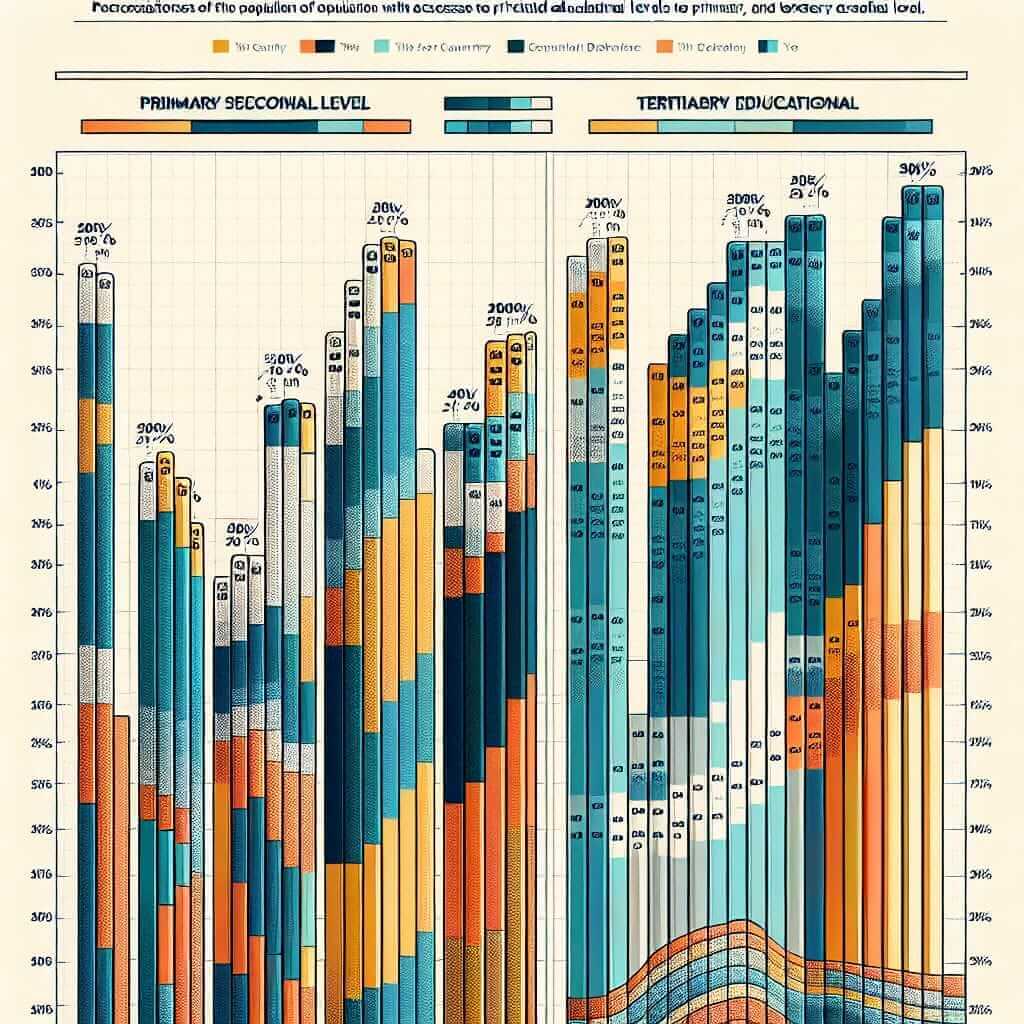
The chart below shows the levels of access to education in selected countries from 2000 to 2023.
Sample Task:
Summarize the information by selecting and reporting the main features, and make comparisons where relevant.
Countries:
- Country A
- Country B
- Country C
- Country D
Selected Concept for the Writing Task
Let’s choose “Comparing Levels of Access to Education in Country A and Country B from 2000-2023” for our detailed analysis and sample writing.
Data Representation
Below is a representation of the data for our sample task. The data shows the percentage of the population with access to primary, secondary, and tertiary education in Country A and Country B from 2000 to 2023.

Table: Percentage of Population with Access to Education
| Year | Country A (Primary) | Country A (Secondary) | Country A (Tertiary) | Country B (Primary) | Country B (Secondary) | Country B (Tertiary) |
|---|---|---|---|---|---|---|
| 2000 | 80% | 60% | 40% | 70% | 50% | 20% |
| 2005 | 85% | 65% | 45% | 75% | 55% | 25% |
| 2010 | 90% | 70% | 50% | 80% | 60% | 30% |
| 2015 | 95% | 75% | 55% | 85% | 65% | 35% |
| 2020 | 100% | 80% | 60% | 90% | 70% | 40% |
| 2023 | 100% | 85% | 65% | 95% | 75% | 45% |
Analysis of the Task
The task requires us to compare the changes in educational access over the given period for both countries. Key points to note include:
- The percentage increase in primary, secondary, and tertiary education.
- Comparisons between the two countries at each educational level over the years.
- Notable trends or patterns, such as overall improvement or periods of stagnant growth.
Sample Response
Below is a sample response based on the data provided.
The bar chart illustrates the percentage of the population with access to primary, secondary, and tertiary education in Country A and Country B from 2000 to 2023. Overall, both countries have shown a significant improvement in access to education over the 23-year period.
In 2000, primary education access for Country A stood at 80%, which increased steadily to reach 100% by 2020, and remained constant through 2023. Similarly, Country B showed a gradual increase from 70% in 2000 to 95% by 2023. This indicates a near-universal access to primary education in both countries by the end of the period.
For secondary education, Country A started at 60% in 2000 and experienced continuous growth, reaching 85% in 2023. Country B also saw progressive improvement from 50% in 2000 to 75% in 2023, though it consistently lagged behind Country A by approximately 10%.
Tertiary education access displayed the most significant disparities between the two countries. In 2000, 40% of Country A’s population had access to tertiary education, which increased to 65% by 2023. Conversely, Country B began at a much lower rate of 20% in 2000, doubling to 45% by 2023. Despite the growth, Country B’s tertiary education access remained significantly lower than that of Country A throughout the years.
In summary, while both countries have made remarkable strides in improving educational access at all levels over the past two decades, Country A consistently outperformed Country B, particularly in tertiary education.
(Word count: 245)
Key Considerations for Writing
Vocabulary and Phrases
- Steadily increased: Indicates a continuous, gradual rise.
- Gradual improvement: Slow but consistent growth.
- Near-universal access: Almost all of the population has access.
- Lagged behind: To fall behind in progress.
- Significant disparities: Notable differences.
Grammatical Structures
- Comparative structures: “Country A started at 60% while Country B began at 50%.”
- Transitional phrases: “Overall”, “Similarly”, “Conversely”.
- Data interpretation: “The bar chart illustrates”, “The data shows”, “As indicated”.
Vocabulary Focus
- Illustrates (verb) /ɪˈlʌstreɪts/
- Meaning: To show or clarify by giving examples.
- Consistent (adjective) /kənˈsɪstənt/
- Meaning: Acting or done in the same way over time.
- Disparity (noun) /dɪˈspærɪti/
- Meaning: A noticeable and often unfair difference.
- Universal (adjective) /ˌjuːnɪˈvɜːrsl/
- Meaning: Applicable to all cases.
- Gradual (adjective) /ˈɡrædʒuəl/
- Meaning: Taking place or progressing slowly or by degrees.
- Steadily (adverb) /ˈstɛdili/
- Meaning: In a regular and even manner.
- Continuous (adjective) /kənˈtɪnjuəs/
- Meaning: Forming an unbroken whole; without interruption.
Conclusion
When tackling the IELTS Writing Task 1 that requires comparing levels of education access, it’s crucial to focus on significant changes and trends within the data. Organize your comparisons logically and support them with accurate data interpretation. Utilize a varied vocabulary and complex grammatical structures to demonstrate higher proficiency. With thorough preparation and practice, you can aim for a Band 7+ in your IELTS Writing Task.