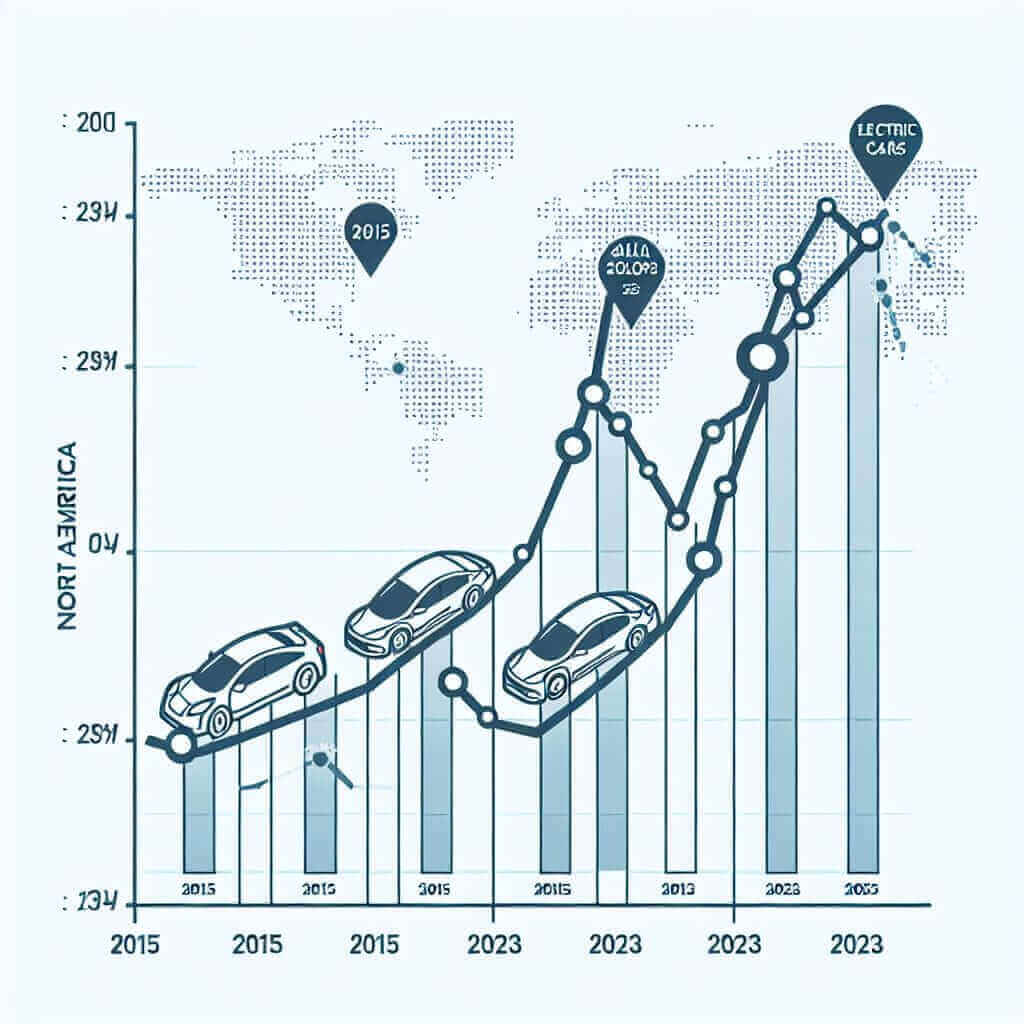
The International English Language Testing System (IELTS) writing task 1 often requires candidates to analyze and describe visual data. Sales of electric cars from 2015 to 2023 across different regions is a relevant and contemporary topic that provides an excellent opportunity to practice data interpretation and description skills. Let’s dive into a detailed analysis and useful techniques that will help you achieve a high score in the IELTS writing task 1.
Suggested IELTS Task 1 Topics
Electric cars have seen substantial growth in sales over the past decade. Here are a few sample task 1 essay prompts based on this theme:
- The chart below shows the sales of electric cars in three different regions (North America, Europe, and Asia) between 2015 and 2023.
- The graph illustrates electric car sales in the United States, China, and Germany from 2015 to 2023.
- The table below illustrates the annual sales figures for electric vehicles in four different countries over an eight-year period.
For this session, let’s select the first prompt and construct a detailed analysis based on it.
Data Representation for Task 1
Before we begin our written analysis, let’s create a fictional dataset to simulate an IELTS task 1 visual prompt:
Electric Car Sales in Different Regions (2015-2023)
| Year | North America | Europe | Asia |
|——-|—————-|——–|——|
| 2015 | 50,000 | 60,000 | 70,000 |
| 2016 | 60,000 | 75,000 | 85,000 |
| 2017 | 70,000 | 90,000 | 100,000 |
| 2018 | 85,000 | 105,000| 120,000 |
| 2019 | 100,000 | 130,000| 150,000 |
| 2020 | 120,000 | 160,000| 185,000 |
| 2021 | 140,000 | 200,000| 220,000 |
| 2022 | 160,000 | 230,000| 250,000 |
| 2023 | 180,000 | 260,000| 300,000 |

Analyzing the Prompt
Understanding the Table
The table displays the number of electric cars sold in North America, Europe, and Asia from 2015 to 2023. Notably, all regions show an upward trend in sales, suggesting an increase in the adoption of electric vehicles globally.
Structuring Your Response
- Introduction
- Overview
- Detailed Paragraphs
Introduction and Overview
Introduction
Begin with a paraphrase of the task prompt. For example:
The table outlines the annual sales figures for electric cars in North America, Europe, and Asia between 2015 and 2023.
Overview
Your overview should highlight major trends or patterns. For example:
Overall, sales of electric cars have risen significantly in all three regions over the specified period. Asia has consistently led in sales, while North America has seen the slowest growth rate compared to Europe and Asia.
Detailed Paragraphs
Paragraph 1
In the initial years, from 2015 to 2017, sales in North America were relatively modest, starting at 50,000 units in 2015 and growing to 70,000 units by 2017. Europe saw a steady increase from 60,000 to 90,000 cars, whereas Asia began with 70,000 units and surged to 100,000 by 2017, maintaining its position as the leader in electric car sales.
Paragraph 2
From 2018 to 2020, sales volumes rapidly increased across all regions. North America’s sales figures jumped from 85,000 to 120,000, and Europe witnessed a remarkable rise from 105,000 to 160,000 electric cars sold. Asia continued its dominance, selling 185,000 units by 2020.
Paragraph 3
The upward trend persisted from 2021 to 2023. North America’s sales soared to 180,000 units, Europe to 260,000 units, and Asia achieved an impressive 300,000 units sold in 2023. Noteworthy is the acceleration in Europe during the later years, closing its gap with Asia.
Vocabulary and Grammar Tips
Useful Vocabulary:
- Surge (v., sɜːdʒ): A sudden large increase. E.g., “Sales surged in 2021.”
- Dominance (n., ˈdɒmɪnəns): The fact of being more powerful or important than other similar things. E.g., “Asia maintained its dominance in the market.”
- Steady (adj., ˈstɛdi): Slow and gradual. E.g., “Europe saw a steady increase.”
- Relatively Modest (collocation., ˈrɛlətɪvli ˈmɒdɪst): Comparatively small in amount. E.g., “North America’s sales were relatively modest.”
- Remarkable (adj., rɪˈmɑːrkəbl): Worthy of attention. E.g., “Europe witnessed a remarkable rise.”
Grammar Tips
- Comparatives and Superlatives: Use these to compare data effectively. E.g., “higher than,” “the greatest growth.”
- Passive Voice: Often used to focus on the action rather than the subject. E.g., “Sales were increased significantly.”
Conclusion
When tackling a task 1 question, focusing on key trends and presenting information logically is crucial to scoring well. Ensure your introduction paraphrases the task prompt, provide a clear overview of the data, and detail specific points in subsequent paragraphs. Expand your vocabulary and utilize advanced grammar to enhance your writing and aim for a Band 7+. Happy writing!