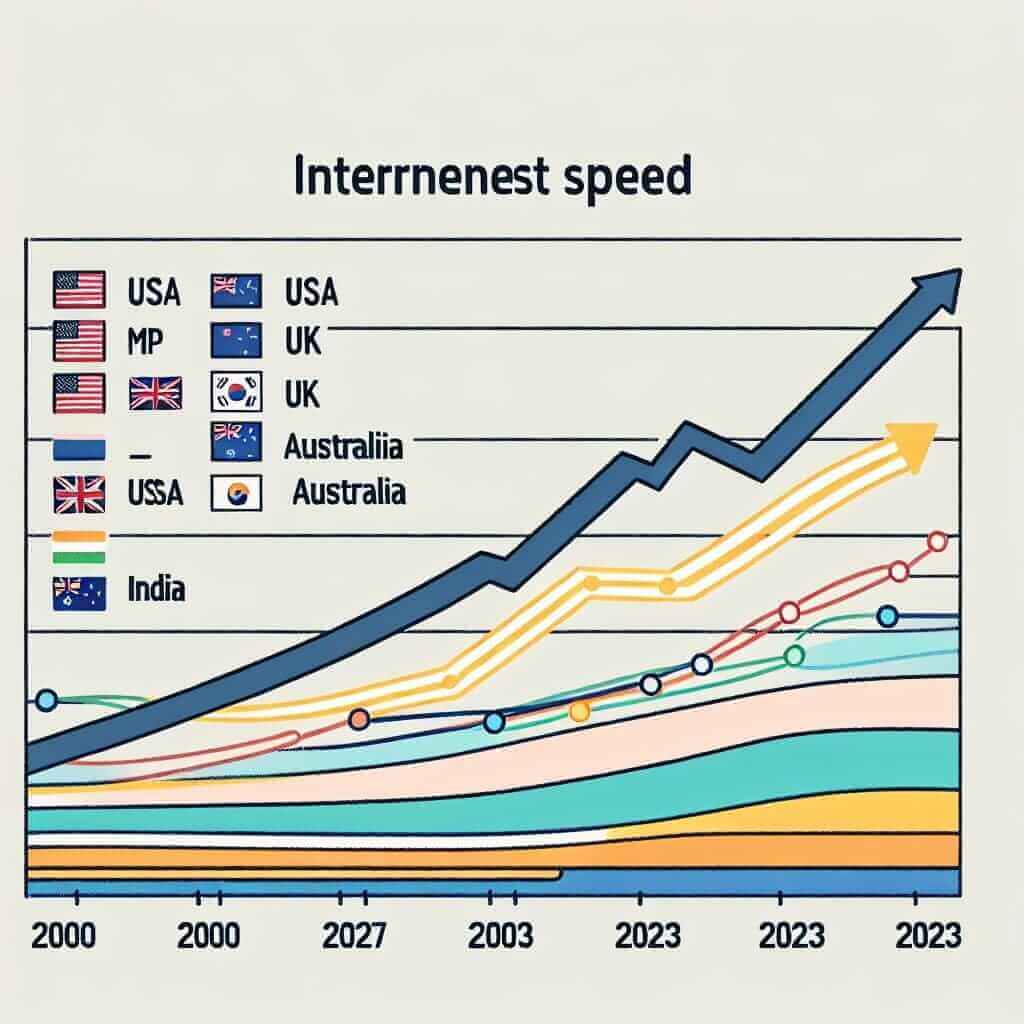
The topic of average internet speed in various countries over the years from 2000 to 2023 is relevant and can often be found in IELTS Writing Task 1. This article aims to provide detailed insights into how to handle such a task, with a mock writing task based on this topic.
Sample Writing Task 1 Prompts
- The chart below shows the average internet speed in different countries from 2000 to 2023. Summarize the information by selecting and reporting the main features, and make comparisons where relevant.
- The table below shows the average internet speed in various countries from 2000 to 2023. Summarize the information by selecting and reporting the main features, and make comparisons where relevant.
- The line graph shows the changes in average internet speed in different countries from 2000 to 2023. Summarize the information by selecting and reporting the main features, and make comparisons where relevant.
Writing Task – Sample Data
Let’s choose the first prompt and present some data in a chart format.
| Year | USA (Mbps) | UK (Mbps) | South Korea (Mbps) | Australia (Mbps) | India (Mbps) |
|---|---|---|---|---|---|
| 2000 | 1.5 | 0.8 | 2.5 | 1.0 | 0.2 |
| 2005 | 3.0 | 2.0 | 5.0 | 3.5 | 1.0 |
| 2010 | 7.0 | 6.5 | 10.5 | 8.0 | 5.5 |
| 2015 | 15.0 | 14.0 | 22.0 | 12.5 | 11.0 |
| 2020 | 30.0 | 25.0 | 50.0 | 20.0 | 21.0 |
| 2023 | 45.0 | 35.0 | 70.0 | 35.0 | 30.0 |

Analyzing the Prompt
The prompt requires summarizing the information from the table, highlighting key trends and making comparisons where relevant.
Key Points to Analyze
- Trend Overview: General trends in internet speed improvements over the years.
- Comparisons: Comparing different countries’ internet speeds at different points in time.
- Notable Features: Highest and lowest speeds, significant changes.
Sample Answer
The table illustrates the average internet speed in five different countries (the USA, the UK, South Korea, Australia, and India) between 2000 and 2023.
Overall, all five countries experienced significant increases in internet speeds over the given period. South Korea consistently had the fastest internet speeds throughout, while India had the slowest, though they saw substantial growth.
In detail, South Korea’s internet speed began at 2.5 Mbps in 2000, rising dramatically to 70 Mbps by 2023, marking a 28-fold increase. Comparatively, the USA’s internet speed increased from 1.5 Mbps in 2000 to 45 Mbps in 2023, reflecting a steady rise.
The UK followed a similar upward trajectory to the USA, starting from 0.8 Mbps in 2000 and reaching 35 Mbps by 2023. Australia saw a considerable enhancement from 1.0 Mbps to 35 Mbps during the same period. Meanwhile, India began with the lowest internet speed of 0.2 Mbps in 2000, which exponentially grew to 30 Mbps by 2023.
By the year 2023, there was a noticeable convergence in internet speeds, especially between the USA, the UK, and Australia, all nearing the 35-45 Mbps range. However, South Korea remained the leader, maintaining a significant edge.
Word Count: 201
Vocabulary and Grammar Tips
Vocabulary
- Consistent (adj) /kənˈsɪstənt/ – always behaving in the same way, showing steady improvement.
- Dramatically (adv) /drəˈmætɪkli/ – by a large amount and very suddenly.
- Trajectory (noun) /trəˈdʒektəri/ – the path followed by an object moving under the action of given forces.
- Enhancement (noun) /ɪnˈhænsmənt/ – an increase or improvement in quality, value, or extent.
- Exponential (adj) /ˌekspəˈnenʃəl/ – becoming more and more rapid.
Grammar Focus
- Comparative Structures:
Use to compare data from different countries.- Example: “South Korea had the fastest internet speed, while India had the slowest.”
- Past Simple and Present Perfect:
Use to describe changes over time.- Example: “South Korea’s speed increased significantly over the years.”
Common Mistakes to Avoid
- Avoid listing numbers without analysis.
- Ensure correct comparative words and adjectives to describe data changes.
- Double-check spelling and grammar errors to maintain professionalism.
Conclusion
In conclusion, tackling a Writing Task 1 that involves summarizing charts or tables requires a clear structure and attention to key trends and comparisons. Utilize comparative structures, detailed descriptions, and accurate vocabulary to achieve Band 7+. Ensure your analysis is coherent, and the data sections are easily understandable, thus meeting the IELTS examiner’s expectations for a higher band score.