Food production has always been a significant topic in various academic discussions, particularly in the IELTS Writing Task 1 due to its relevance and global importance. In this article, we will explore this topic in detail, providing you with a sample question, data analysis, and a model answer to help you achieve a high band score.
Table Of Contents
Introduction
The topic “Food Production in Different Regions (2000-2023)” commonly appears in IELTS Writing Task 1, where candidates are required to describe, summarize, or explain the information presented in a graph, chart, or table. Understanding how to approach this topic can significantly enhance your writing skills and overall IELTS score.
Example Tasks
Here are some example tasks that could be based on our topic:
-
The table below shows the production of various food items in three different regions between 2000 and 2023. Summarize the information by selecting and reporting the main features and make comparisons where relevant.
-
The bar chart illustrates the changes in food production in different parts of the world from 2000 to 2023. Summarize the information by selecting and reporting the main features and make comparisons where relevant.
-
The line graph below shows the trends in food production in North America, Europe, and Asia from 2000 to 2023. Summarize the information by selecting and reporting the main features and make comparisons where relevant.
For this lesson, we will choose the first example task to demonstrate a complete sample answer.
Analyze the Question
Task
The table below shows the production of various food items (in million tonnes) in three different regions (North America, Europe, and Asia) between 2000 and 2023. Summarize the information by selecting and reporting the main features and make comparisons where relevant.
Data
Imagine the table is as follows:
| Year | Region | Grain | Vegetables | Meat |
|---|---|---|---|---|
| 2000 | North America | 100 | 50 | 80 |
| 2000 | Europe | 90 | 60 | 70 |
| 2000 | Asia | 80 | 70 | 90 |
| 2023 | North America | 110 | 55 | 85 |
| 2023 | Europe | 95 | 65 | 75 |
| 2023 | Asia | 85 | 75 | 100 |
 Food Production Comparison
Writing the Sample Answer
Introduction
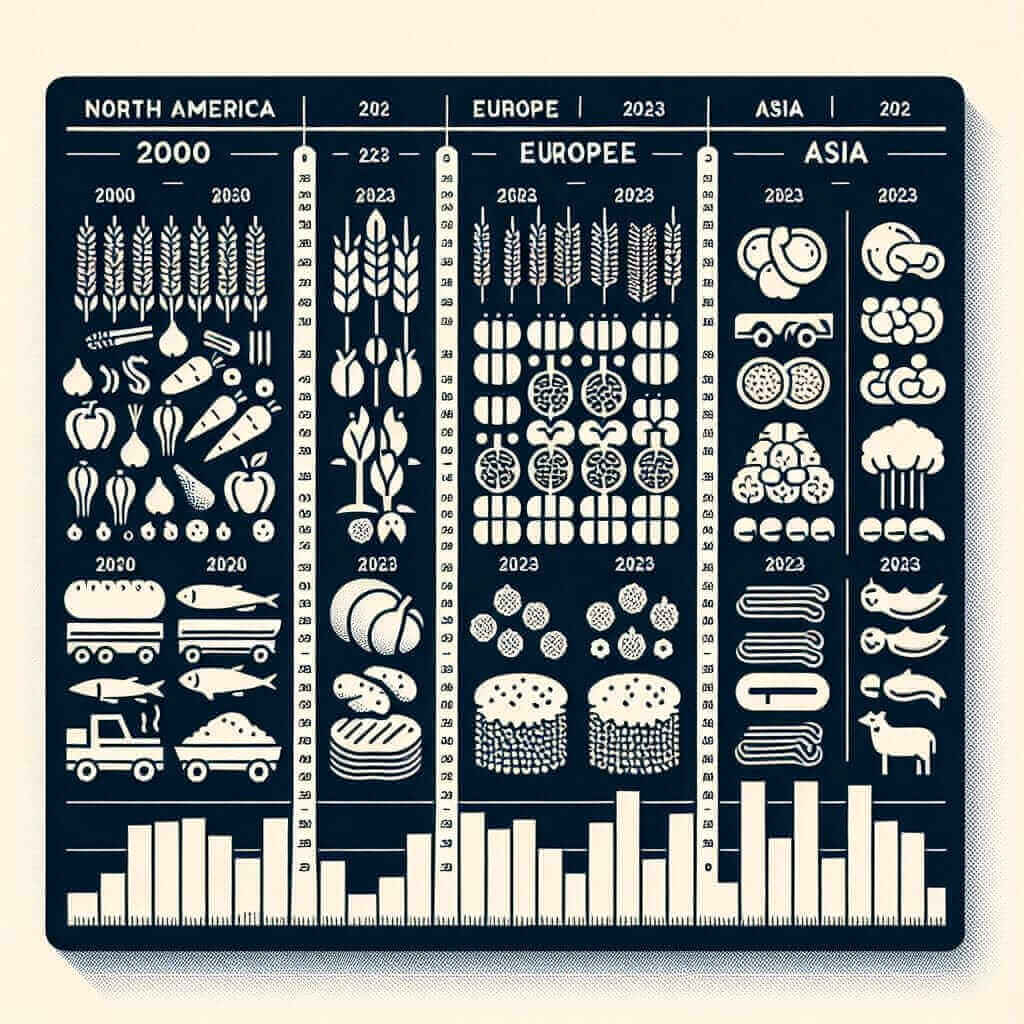
The table illustrates the production of grain, vegetables, and meat across North America, Europe, and Asia in the years 2000 and 2023. Overall, it is evident that food production has generally increased in all three regions over the given period.
Overview
In summary, Asia produced the most meat in both years, while North America and Europe had similar production levels for grain and vegetables. There was a noticeable increase in the production of all three food items in each region from 2000 to 2023.
Body Paragraph 1
In 2000, North America produced 100 million tonnes of grain, slightly higher than Europe at 90 million tonnes and Asia at 80 million tonnes. By 2023, North America’s grain production rose to 110 million tonnes, maintaining its lead, while Europe’s production increased slightly to 95 million tonnes. Asia saw the least increase in grain production, reaching 85 million tonnes in 2023.
Body Paragraph 2
With vegetables, Europe led production in 2000 with 60 million tonnes, compared to North America’s 50 million tonnes and Asia’s 70 million tonnes. By 2023, North America and Europe experienced moderate increases to 55 and 65 million tonnes respectively, while Asia’s production surged to 75 million tonnes, making it the leading region for vegetable production.
Body Paragraph 3
Regarding meat production, Asia was the top producer in both years, growing from 90 million tonnes in 2000 to 100 million tonnes in 2023. North America’s meat production rose from 80 to 85 million tonnes. Europe’s production saw a smaller increase, from 70 million tonnes in 2000 to 75 million tonnes in 2023.
Word Count
The total word count for this sample response is 248 words.
Tips for Writing
- Structure: Follow a clear structure with an introduction, overview, and body paragraphs.
- Vocabulary: Use varied and precise vocabulary to describe the data.
- Comparisons: Effectively compare changes over time and between regions.
- Grammar: Use complex sentences and appropriate tense to describe data accurately.
Vocabulary to Remember
- Illustrate (verb) /ˈɪləˌstreɪt/: To show or demonstrate something clearly.
- Production (noun) /prəˈdʌkʃən/: The process of creating or manufacturing goods.
- Noticeable (adjective) /ˈnoʊtɪsəbəl/: Easily seen or detected.
- Surge (verb) /sɜrdʒ/: To increase suddenly and significantly.
- Moderate (adjective) /ˈmɒdərɪt/: Average in amount, intensity, or degree.
Conclusion
Successfully addressing IELTS Writing Task 1 requires clear structure, accurate data interpretation, and effective language use. When writing about food production in different regions, ensure to compare changes and highlight significant trends. Practice regularly with various data presentations to enhance your skills and achieve a higher band score.
By following the guidelines and practicing with diverse topics, you can master this part of the IELTS and strengthen your overall English proficiency.


