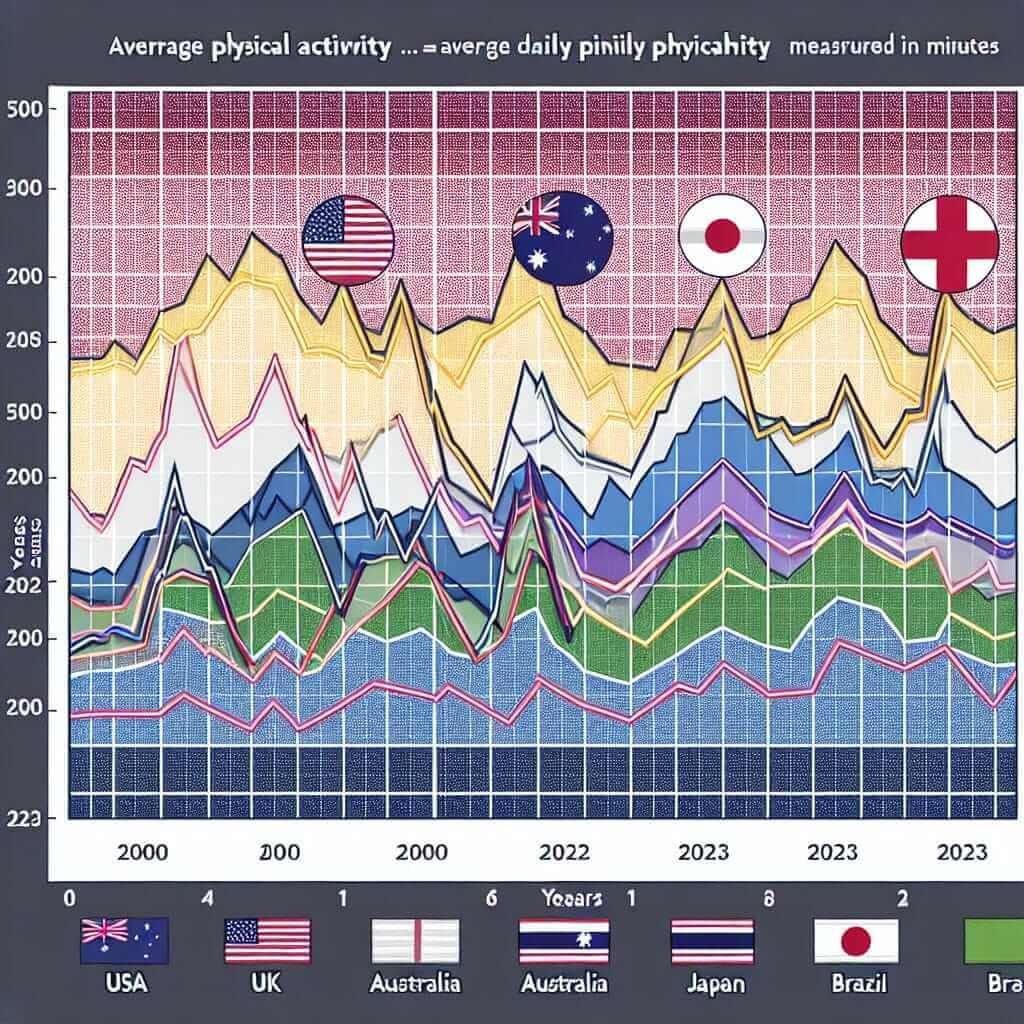
“Average Daily Physical Activity in Various Countries (2000-2023)” is a compelling topic frequently encountered in IELTS Writing Task 1. This article delves into the intricacies of this subject, analyzing trends, data interpretation, and presenting useful tips, with a focus on improving your writing skills in the IELTS exam.
To kick off, let’s look at some potential IELTS Writing Task 1 prompts related to this topic:
- The graph below shows the average daily physical activity levels in various countries between 2000 and 2023. Summarize the information by selecting and reporting the main features, and make comparisons where relevant.
- The table below illustrates the average daily physical activity (measured in minutes) in different countries from 2000 to 2023. Summarize the key information, and make comparisons where necessary.
- The charts below compare the average daily physical activity trends in selected countries over the period from 2000 to 2023. Summarize the information by identifying key trends and differences.
For this article, we will choose the first prompt for detailed analysis.
Choosing and Creating Sample Data
To authentically analyze the selected prompt, let’s create a hypothetical graph depicting the average daily physical activity measured in minutes for five countries: USA, UK, Australia, Japan, and Brazil, between 2000 and 2023. Here is a table summarizing our data:
| Year | USA | UK | Australia | Japan | Brazil |
|---|---|---|---|---|---|
| 2000 | 30 | 35 | 42 | 50 | 45 |
| 2005 | 32 | 37 | 44 | 52 | 43 |
| 2010 | 35 | 40 | 46 | 54 | 47 |
| 2015 | 37 | 42 | 48 | 55 | 49 |
| 2020 | 39 | 44 | 50 | 56 | 51 |
| 2023 | 40 | 46 | 52 | 58 | 53 |
We will use this data to create a line graph.

Analyzing the Prompt
The prompt asks us to summarize the information by identifying the main features and making comparisons where relevant.
Step-by-Step Approach:
- Introduction Sentence: Paraphrase the prompt and outline the scope of the analysis.
- Overview: Highlight the key trends and prominent features of the data. For instance, general observations such as overall increases or decreases.
- Detailed Paragraphs: Break down the data into detailed points, focusing on specific trends and comparisons among countries.
- Language Tips: Use appropriate vocabulary, grammar structures, and comparative language effectively.
Sample Writing Task
Introduction:
The graph illustrates the average daily physical activity (in minutes) in the USA, UK, Australia, Japan, and Brazil from 2000 to 2023.
Overview:
Overall, all five countries experienced an upward trend in the average daily physical activity over the given period. Notably, Japan consistently had the highest levels of physical activity, while the USA recorded the lowest.
Details:
From 2000 to 2023, Japan’s average daily physical activity increased from 50 minutes to 58 minutes, making it the most physically active country throughout the period. Similarly, Brazil showed significant growth, albeit starting at a higher base of 45 minutes in 2000 reaching 53 minutes by 2023.
The USA, starting at 30 minutes in 2000, recorded the lowest physical activity levels among the five countries but observed a steady increase, reaching 40 minutes in 2023. In the UK and Australia, the figures rose steadily; the UK grew from 35 minutes to 46 minutes, while Australia increased from 42 minutes to 52 minutes during the same period.
Concluding Sentence:
In conclusion, Japan maintained a clear lead in daily physical activity levels, while the USA lagged behind but showed gradual improvement. The UK, Australia, and Brazil exhibited moderate yet consistent increases.
(Word Count: 212)
Tips and Important Notes
Vocabulary and Grammar:
- Use comparatives (higher, lower, more, less) and superlatives (the highest, the lowest) effectively.
- Employ linkers (moreover, however, similarly) to maintain coherence.
- Adverbs of frequency (consistently, generally, steadily) are vital for trend descriptions.
Vocabulary:
- Trend (noun) – /trɛnd/: a general direction in which something is developing or changing.
- Consistent (adjective) – /kənˈsɪstənt/: unchanging in nature, standard, or effect over time.
- Upward (adjective) – /ˈʌpwərd/: moving towards a higher place or condition.
- Prominent (adjective) – /ˈprɑːmɪnənt/: important; famous.
- Base (noun) – /beɪs/: the bottom or starting point.
- Moderate (adjective) – /ˈmɒdərɪt/: average in amount, intensity, quality, or degree.
- Gradual (adjective) – /ˈɡrædʒuəl/: taking place or progressing slowly or by degrees.
- Increase (verb) – /ɪnˈkriːs/: become or make greater in size, amount, or degree.
- Compare (verb) – /kəmˈpɛr/: estimate, measure, or note the similarity or dissimilarity between.
- Illustrate (verb) – /ˈɪləstreɪt/: explain or make (something) clear by using examples, charts, pictures, etc.
Conclusion
When tackling an IELTS Writing Task 1, it is vital to familiarize yourself with the common topics and practice structuring your response effectively. By honing your vocabulary and grammar, employing comparisons, and consistently analyzing trends, you can achieve a strong band score.
By focusing on precision and clarity, you can aim for a Band 7+ score in the IELTS writing task.