The topic of “Sales of Different Types of School Supplies (2000-2023)” is a frequent subject in IELTS Writing Task 1. Understanding how to describe and analyze such data can significantly improve your performance in the task. In this article, we will explore this topic in depth, creating a sample task and providing tips on grammar, vocabulary, and writing strategies to help you achieve a high band score.
IELTS Task on School Supplies Sales
You might encounter a task similar to the following in your IELTS writing exam:
Sample Task:
“The bar chart below illustrates the sales trends of three different types of school supplies (pencils, notebooks, and erasers) from 2000 to 2023. Summarize the information by selecting and reporting the main features, and make comparisons where relevant.”
Before diving into the analysis and writing, let’s present a factual bar chart to serve as our reference.
Data Presentation
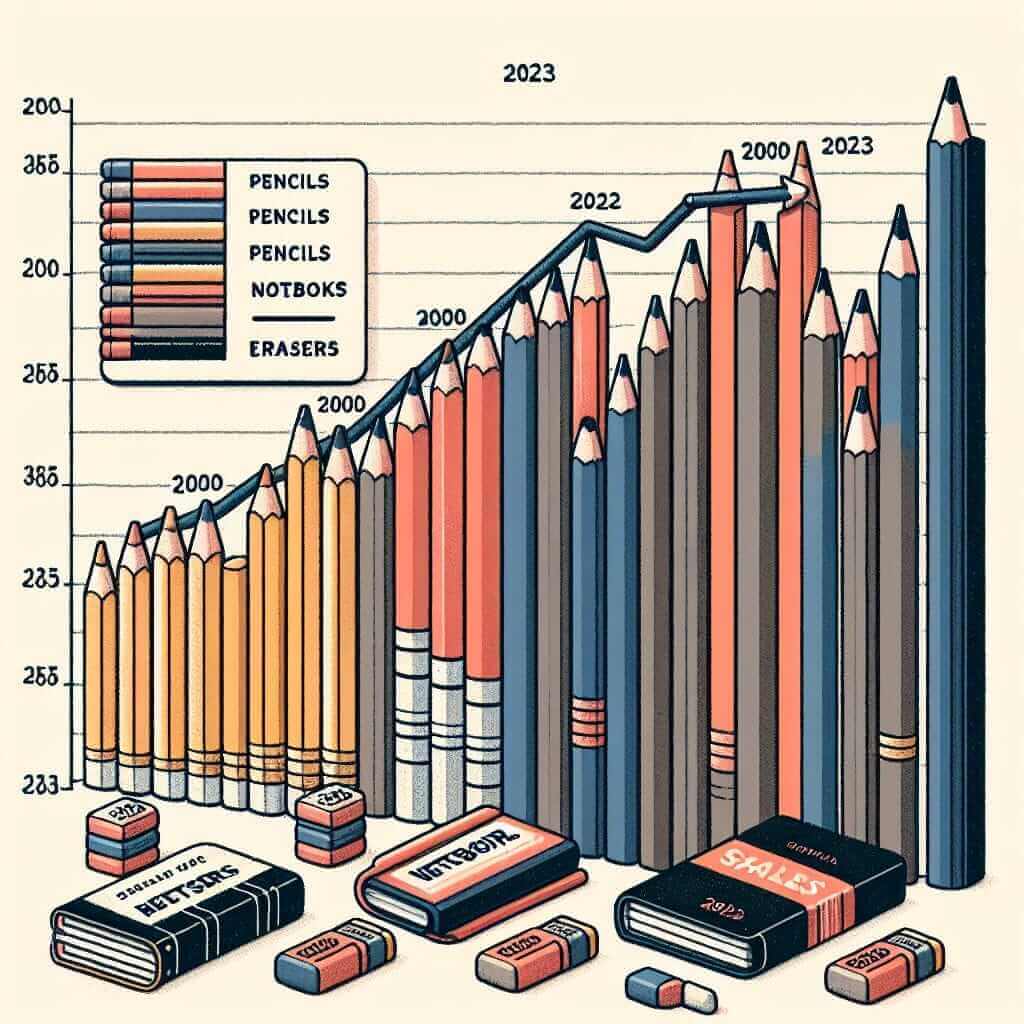
Below is a mock-up bar chart created based on hypothetical data for the sales of different school supplies across the years mentioned.

Note: Ensure you refer to actual data sources if available for accuracy.
Analyzing the Sales Trends Data
Carefully examining the chart, you should observe:
-
Pencils:
- Steady increase in sales from 2000 to 2010.
- A peak in 2015, followed by a slight decline.
- Stabilization from 2018 to 2023.
-
Notebooks:
- Significant rise in sales, particularly noticeable around the early 2010s.
- Sharp decrease from 2015 onwards.
- Sales relatively stagnant from 2020 to 2023.
-
Erasers:
- Fluctuating sales with minor ups and downs throughout the period.
- Significant drop in sales post-2020.
Sample Writing Task
Task Response
Analyzing the given bar chart, one can observe the trends in the sales of pencils, notebooks, and erasers over the specified period. Let’s create a model response:
Sample Answer:
The bar chart illustrates the sales trends of pencils, notebooks, and erasers from 2000 to 2023.
Overall, the sales of pencils demonstrated a steady upward trend until 2015, after which they began to stabilize. Initially, the sales rose from 100,000 units in 2000 to 200,000 units in 2010, peaking at 250,000 units in 2015. However, there was a minor decline, and the sales plateaued at around 220,000 units by 2023.
In contrast, notebook sales experienced a dramatic rise, especially in the early 2010s, peaking in 2013 with sales of 300,000 units. This was followed by a steep decline, with sales dropping to about 120,000 units by 2021, and then stabilizing. Noteworthy is the stark reduction in sales starting from 2015, likely due to changes in consumer preferences or increased competition.
Erasers, on the other hand, displayed fluctuating sales. Starting at 75,000 units, their sales oscillated slightly before experiencing a notable decrease post-2020. By the end of the period, eraser sales had diminished to approximately 50,000 units.
In summary, while pencils maintained moderate growth and stability, notebooks and erasers encountered significant variability, with notebooks declining sharply after a peak and erasers gradually decreasing in sales towards the end of the observed period.
Word Count: 203
Tips for Writing an Effective Task 1 Response
- Identify Key Trends: Always look for the major trends and changes in the data. Compare and contrast where relevant.
- Structure: Use an introduction, an overview, and then present your details in clear, logical paragraphs.
- Use Data Effectively: Cite figures from the chart accurately to illustrate your points.
- Maintain Formal Tone: Use formal academic language and avoid personal pronouns.
- Proofread: Check for grammatical errors and ensure coherence and cohesion in your writing.
Important Vocabulary
Here are some essential vocabulary terms used in such contexts:
- Fluctuate (v) /ˈflʌktʃueɪt/: to vary or change often.
- Plateau (v) /ˈplætəʊ/: to reach a state of little or no change.
- Surge (n) /sɜrdʒ/: a sudden, large increase.
- Decline (n) /dɪˈklaɪn/: a gradual and continuous loss.
- Peak (v) /piːk/: to reach the highest point.
Conclusion
When writing about the sales trends of school supplies or any similar data, focus on highlighting and comparing major trends, using relevant figures from the data to support your observations. By applying these tips, you can enhance your IELTS Writing Task 1 performance and aim for a higher band score. Keep practicing with various charts and datasets to hone your analytical and descriptive skills.