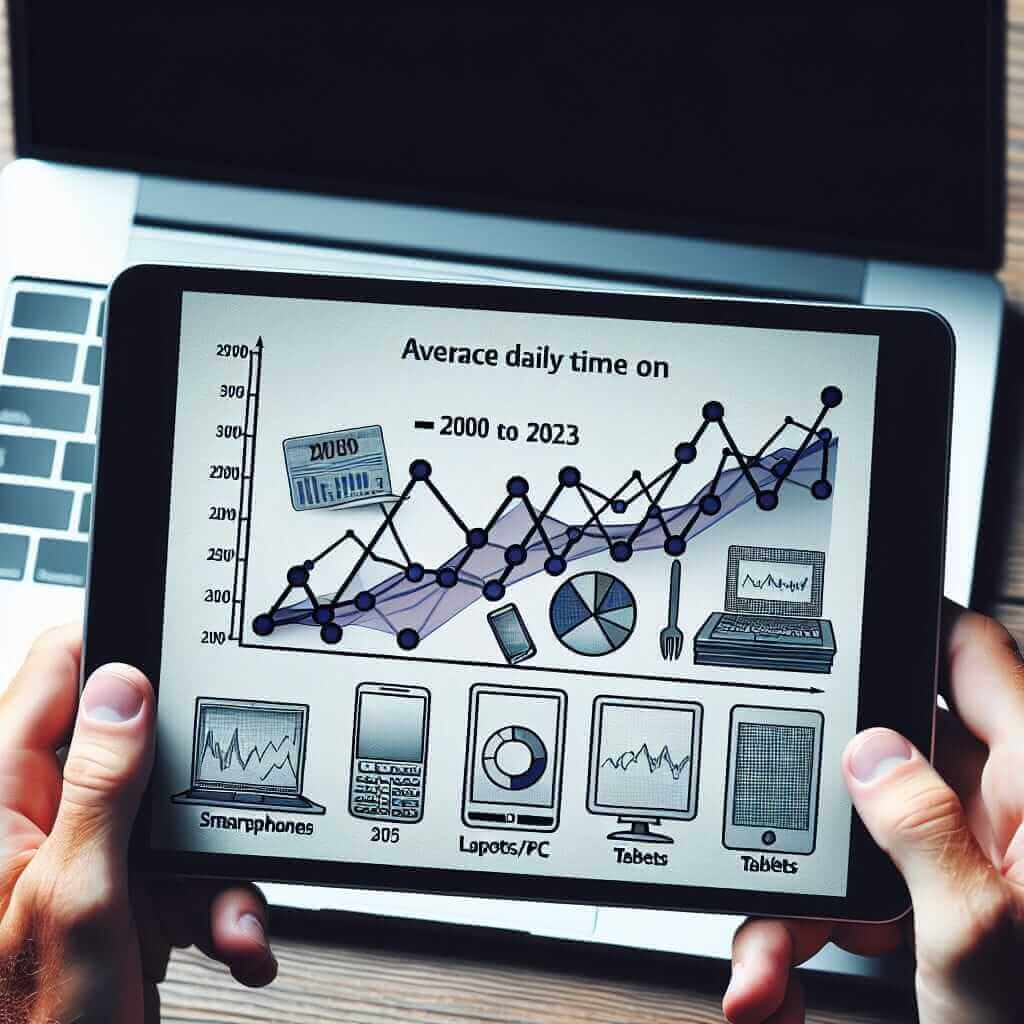
The topic “Average Daily Time Spent on Digital Devices (2000-2023)” is quite relevant to contemporary life, as digital device usage has significantly increased over the past two decades. Understanding this trend is essential, not only for general knowledge but also for those preparing for the IELTS exam, particularly the Writing Task 1.
In this lesson, you will:
- Analyze the trends in digital device usage from 2000 to 2023.
- Practice interpreting data visualizations commonly found in IELTS Writing Task 1.
- Write a sample response to a related task.
- Learn useful vocabulary and grammar structures for describing trends.
Sample Task 1 Prompt
You should spend about 20 minutes on this task.
The chart below shows the average daily time spent on digital devices between 2000 and 2023.
Summarize the information by selecting and reporting the main features, and make comparisons where relevant.
Write at least 150 words.
Data Analysis and Visualization
To effectively write about the given prompt, let’s first create and analyze a hypothetical chart representing the average daily time spent on digital devices from 2000 to 2023.
Hypothetical Data Visualization:
| Year | Smartphone | Laptop/PC | Tablet | Total |
|---|---|---|---|---|
| 2000 | 0.1 hours | 1.2 hours | 0 | 1.3 |
| 2005 | 0.3 hours | 1.8 hours | 0 | 2.1 |
| 2010 | 1.5 hours | 2.5 hours | 0.2 | 4.2 |
| 2015 | 2.8 hours | 2.3 hours | 1.1 | 6.2 |
| 2020 | 3.5 hours | 2.0 hours | 1.8 | 7.3 |
| 2023 | 4.0 hours | 1.5 hours | 2.0 | 7.5 |

Chart Interpretation:
- Smartphones: The usage has seen a significant increase, starting from just 0.1 hours in 2000 to 4 hours by 2023.
- Laptop/PC: Usage peaked around 2010 at 2.5 hours but has declined to 1.5 hours in 2023.
- Tablets: First usage recorded in 2010 at 0.2 hours, growing consistently to 2 hours by 2023.
- Total Usage: Total average daily time has surged from 1.3 hours in 2000 to 7.5 hours in 2023.
Task Analysis
This task involves summarizing the data and making comparisons between the different years and types of digital devices. It requires clear and concise reporting of the main features and significant trends.
Sample Answer
The chart provided depicts the average daily time spent on digital devices—smartphones, laptops/PCs, and tablets—between the years 2000 and 2023.
Overall, there has been a substantial rise in daily digital device usage over the 23-year period. The most notable increase is seen in smartphone usage, which skyrocketed from a mere 0.1 hours in 2000 to 4 hours by 2023. Tablets, which were not used until 2010, have also seen a steady rise, reaching 2 hours daily in 2023.
Conversely, the daily usage of laptops/PCs, which initially surged from 1.2 hours in 2000 to a peak of 2.5 hours in 2010, has gradually declined, settling at 1.5 hours in 2023.
The cumulative time spent on digital devices has similarly increased over the years. Starting at just 1.3 hours daily in 2000, total usage escalated to 7.5 hours by 2023, highlighting a significant shift towards a more digitally oriented lifestyle.
Word Count: 161
Tips for Writing
-
Structure:
- Introduction: Briefly introduce what the chart shows.
- Overview: Highlight the main trends without specific data.
- Body Paragraphs: Provide detailed comparisons and specific data points.
-
Grammar and Vocabulary:
- Past, Present Perfect, and Future Tenses: Different times can be used to describe data trends.
- Comparative and Superlative Forms: For comparing data points (e.g., “greater than,” “the highest”).
- Linking Words and Phrases: Use phrases like “while,” “whereas,” “in comparison to,” etc.
Vocabulary
- Skyrocket (v) /ˈskaɪˌrɒkɪt/: Increase rapidly.
- Consistently (adv) /kənˈsɪstəntli/: Regularly, without changing.
- Decline (v) /dɪˈklaɪn/: Decrease.
- Surge (v) /sɜːdʒ/: Increase suddenly.
- Cumulative (adj) /ˈkjuːmjʊlətɪv/: Increasing in quantity by successive additions.
Conclusion
In summary, writing about trends in digital device usage requires a clear understanding of the data and the ability to articulate main features and comparisons concisely. By following a structured approach and incorporating relevant vocabulary and grammar, you can aim for a Band 7+ in your IELTS Writing Task 1.