Introduction: The Importance of Mastering IELTS Writing Task 1
The IELTS Writing Task 1 often presents a significant hurdle for many test-takers. As educators, our role is to equip students with the necessary skills and strategies to confidently tackle this section. This guide delves into effective techniques for teaching IELTS Writing Task 1, drawing from my 20+ years of experience.
Understanding IELTS Writing Task 1
What is IELTS Writing Task 1?
In Task 1 of the IELTS Academic Writing test, students are presented with a visual input – a graph, chart, table, diagram, or map. They are then asked to describe, summarize, or explain the information provided in their own words within a minimum of 150 words.
Why is it Important?
Task 1 assesses a candidate’s ability to:
- Comprehend and interpret visual data: This is a crucial skill in academic settings.
- Present information clearly and accurately: Effective communication relies on clear and concise writing.
- Use appropriate vocabulary and grammar: Students must demonstrate their command of English language.
Effective Strategies for Teaching IELTS Writing Task 1
1. Building a Strong Foundation:
- Vocabulary Development: Focus on teaching topic-specific vocabulary related to trends, changes, comparisons, and data interpretation (e.g., increase, decrease, fluctuate, significant, minimal, in contrast, similarly).
- Grammar Focus: Emphasize grammatical structures used in describing data, including:
- Prepositions of time and place (e.g., from, to, in, at).
- Tenses (past simple, present perfect, future) to accurately reflect the time frame presented in the visual.
- Comparatives and superlatives to highlight trends and differences.
- Understanding Visuals: Teach students to identify key features of different visual types (graphs, charts, maps, etc.). Practice analyzing and extracting important information.
2. Mastering the Structure:
- The Four-Paragraph Structure: Guide students to adopt a clear structure for their response:
- Introduction: Paraphrase the task question and state the main trend/s.
- Overview: Summarize the key features and overall trends, avoiding specific data.
- Body Paragraph 1: Describe the most significant details with supporting figures.
- Body Paragraph 2: Provide further details or highlight contrasting information.
3. Developing Writing Skills:
- Practice with Real IELTS Materials: Utilize past papers and sample tasks to familiarize students with the exam format and question types.
- Provide Regular Feedback: Offer constructive criticism on both content and language. Focus on areas like data accuracy, coherence, vocabulary, and grammar.
- Encourage Peer Review: Create opportunities for students to review each other’s work, fostering a collaborative learning environment.
4. Teaching Essential Language:
- Language of Change: Introduce verbs, nouns, adverbs, and adjectives to describe changes (e.g., rise, decline, steady, gradual, sharp).
- Making Comparisons: Teach comparative structures and vocabulary for highlighting differences and similarities (e.g., higher than, lower than, similarly, in contrast).
- Expressing Approximation: Introduce phrases to present approximate figures (e.g., approximately, nearly, just over, slightly less than).
Example: Analyzing a Line Graph
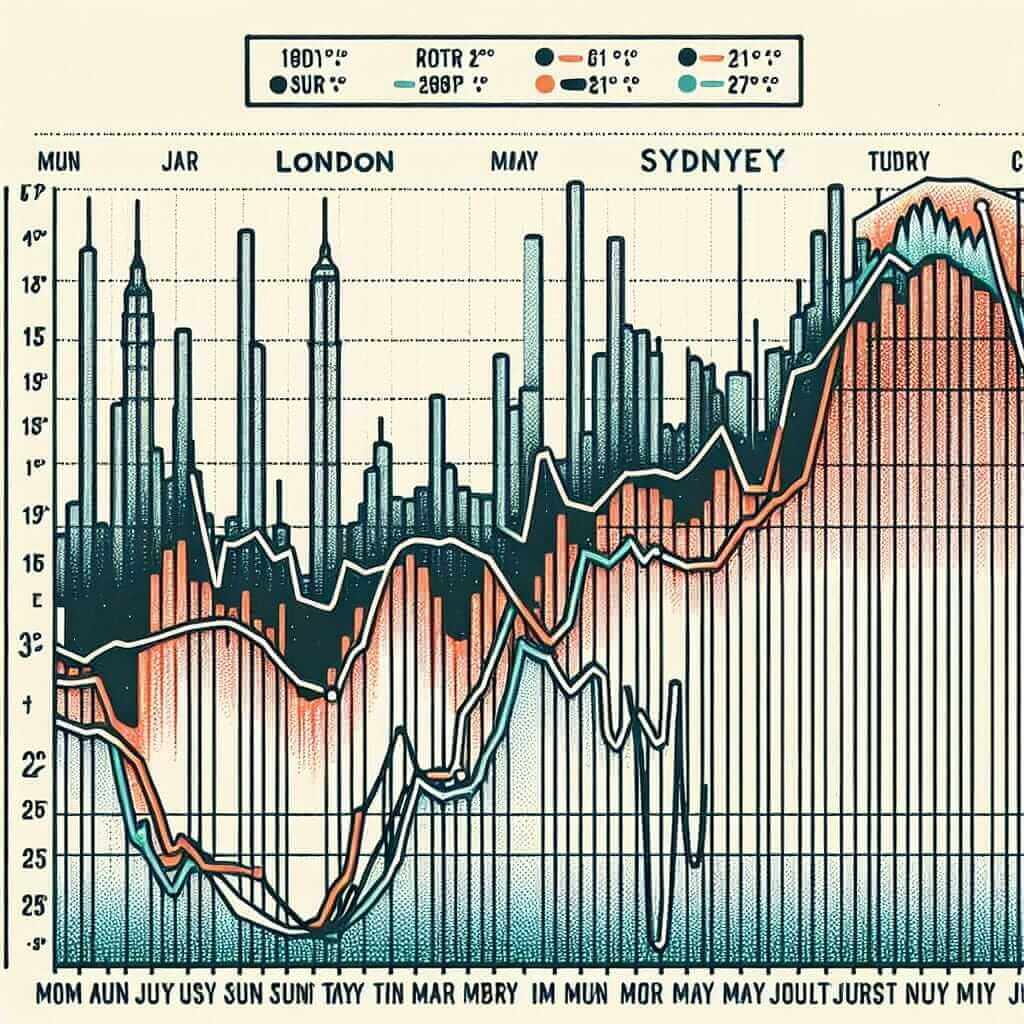
Task: The graph below shows the average monthly temperatures in London and Sydney. Summarize the information by selecting and reporting the main features, and make comparisons where relevant.

Sample Introduction:
The line graph illustrates the monthly average temperatures in degrees Celsius for the cities of London and Sydney.
Sample Overview:
Overall, it is evident that Sydney experiences significantly warmer temperatures than London throughout the year. While London’s climate is characterized by distinct seasons, Sydney maintains relatively mild temperatures.
Sample Body Paragraph:
In London, the average temperature peaks at around 18 degrees Celsius in July and August, dropping to its lowest point in January at around 5 degrees Celsius. In contrast, Sydney’s warmest months are December to February, with temperatures reaching approximately 25 degrees Celsius. Sydney’s mildest month is July, averaging around 15 degrees Celsius.
Tips for Success:
- Time Management: Advise students to allocate approximately 20 minutes to Task 1, leaving sufficient time for Task 2.
- Understanding the Scoring Criteria: Explain the IELTS Writing band descriptors, emphasizing the importance of task achievement, coherence and cohesion, lexical resource, and grammatical range and accuracy.
- Practice, Practice, Practice: Encourage consistent practice and provide ample opportunities for feedback.
Conclusion
Teaching IELTS Writing Task 1 effectively requires a structured approach that emphasizes vocabulary development, grammar accuracy, and a clear understanding of data analysis and presentation. By equipping students with the right tools and strategies, we can empower them to excel in this crucial section of the IELTS exam.