The IELTS Writing Task 1 can seem daunting, especially if you’re not sure how to approach it. This guide will provide you with a clear understanding of the task, along with practical strategies to help you achieve a band 7 or higher.
Understanding IELTS Writing Task 1
In Task 1 of the IELTS Academic Writing test, you’ll be presented with a visual representation of data – this could be a graph, chart, table, diagram, or a combination of these. Your task is to describe the key features and trends presented in the visual information in your own words.
Why is Task 1 important?
Task 1 assesses your ability to:
- Objectively analyze and interpret visual data.
- Present information clearly and accurately.
- Use a range of appropriate vocabulary and grammar structures.
Types of Visual Data in Task 1
Familiarizing yourself with the different types of visuals you might encounter is crucial for effective preparation:
- Line Graphs: Show trends over a period of time.
- Bar Charts: Compare quantities across different categories.
- Pie Charts: Illustrate proportions of a whole.
- Tables: Present data in rows and columns.
- Diagrams: Explain processes or illustrate how something works.
- Maps: Show geographical changes or locations.
Steps to Write an Effective Task 1 Response
1. Analyze the Visual Carefully
- Identify the type of visual: This will guide your language and structure.
- Understand the axes and labels: What is being measured? What are the units?
- Highlight key features: Look for significant trends, patterns, peaks, lows, or changes.
2. Structure Your Response
A well-structured response is essential for clarity and coherence. Follow this format:
- Introduction (1-2 sentences): Paraphrase the task question and state the main purpose of the visual.
- Overview (2-3 sentences): Summarize the key trends or patterns without including specific data.
- Body Paragraphs (2-3 paragraphs): Describe specific details, comparisons, and supporting data. Group similar trends together in paragraphs.
- (Optional) Conclusion (1 sentence): A brief concluding sentence can be added to summarize the overall message of the data, but it is not always necessary.
3. Use Appropriate Language
- Vocabulary for Describing Trends: increase, decrease, rise, fall, fluctuate, peak, plateau, remain stable, etc.
- Comparatives and Superlatives: higher than, the lowest, the most significant, etc.
- Prepositions of Time: from…to, between…and, during, over, etc.
- Approximations: approximately, roughly, nearly, around, etc.
- Formal Language: Avoid contractions (don’t, can’t), informal language, and personal opinions.
4. Pay Attention to Grammar and Accuracy
- Subject-verb agreement: Ensure your verbs agree with your subjects.
- Tense consistency: Use tenses accurately to reflect the time frame in the data.
- Accurate data representation: Avoid misinterpreting or misrepresenting the data.
- Word count: Write at least 150 words.
Example Task and Response
Task:
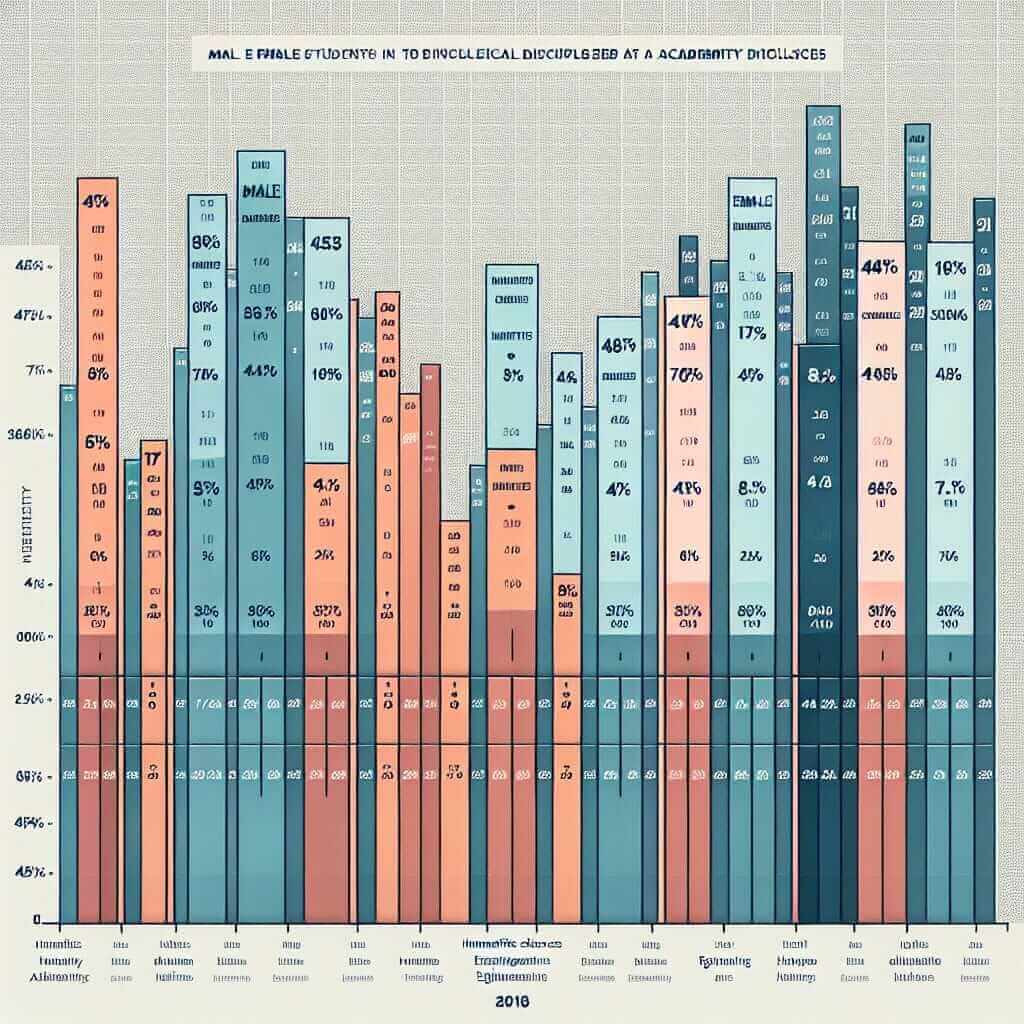
The chart below shows the number of male and female students who enrolled in different courses at a university in 2018.

Response:
The bar chart illustrates the enrollment figures for male and female students across various academic disciplines at a particular university in the year 2018.
Overall, the university observed a higher enrollment of female students compared to their male counterparts in the majority of courses. Business Studies was the most popular course among both genders, while Engineering recorded the most significant gender disparity in enrollment.
In terms of specific numbers, Business Studies attracted the highest number of students overall, with approximately 180 females and 150 males enrolling. Similarly, Law proved to be another sought-after discipline, with slightly over 100 female and 80 male students. However, a stark contrast is evident in Engineering, where only 40 females enrolled compared to a significantly higher number of males, reaching almost 160. Humanities and Science courses showed more balanced enrollments, with a slightly higher number of females in both disciplines.
Tips for Success
- Practice regularly: Familiarize yourself with different question types and data sets.
- Time management: Allocate about 20 minutes for Task 1.
- Proofread carefully: Check for grammar, spelling, and vocabulary errors.
- Get feedback: Have a teacher or tutor review your writing and provide feedback.
By following these steps and practicing consistently, you’ll be well on your way to achieving a high score in IELTS Writing Task 1. Good luck!