Understanding the Importance of Data Interpretation
Interpreting data accurately is a crucial skill for success in IELTS Writing Task 1. This task requires candidates to describe, summarize, and compare information presented in various types of visual aids, such as graphs, charts, tables, maps, or diagrams. Mastering data interpretation not only helps you achieve a higher band score but also enhances your ability to analyze and communicate complex information effectively.
Key Components of Data Interpretation
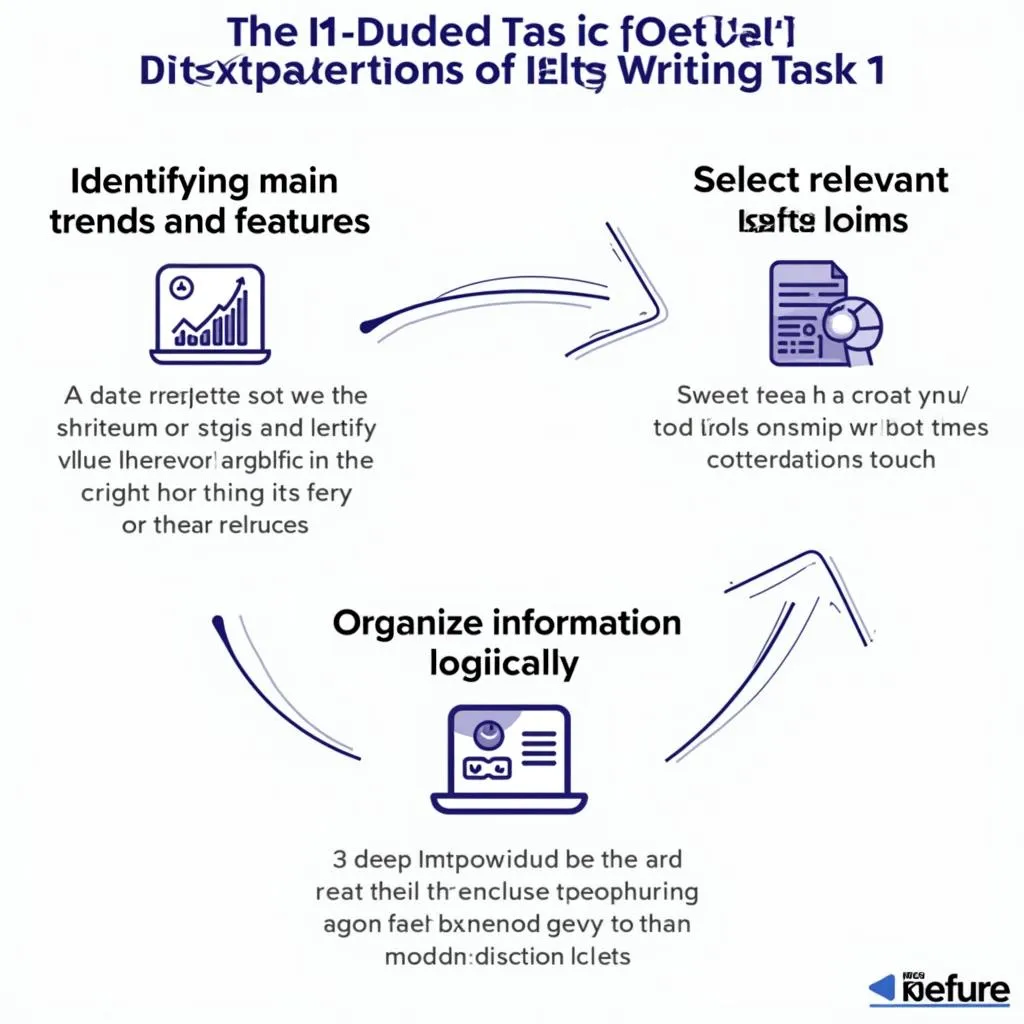
To excel in IELTS Writing Task 1, you need to focus on three main aspects:
- Identifying main trends and features
- Selecting relevant data points
- Organizing information logically
By developing these skills, you’ll be able to craft well-structured, coherent responses that accurately convey the presented data.

Strategies for Effective Data Interpretation
1. Analyze the Big Picture
Before diving into specific details, take a moment to understand the overall message of the visual aid. Ask yourself:
- What is the main trend or pattern?
- Are there any significant changes or turning points?
- How does the data evolve over time (if applicable)?
This initial analysis will help you structure your response and identify the most important information to include.
2. Identify Key Features
Look for notable characteristics in the data, such as:
- Highest and lowest values
- Significant increases or decreases
- Unexpected fluctuations or anomalies
- Similarities or differences between categories
Highlighting these key features will demonstrate your ability to discern important information from the visual aid.
3. Group Related Information
Organize your response by grouping related data points together. This approach helps create a logical flow and makes your writing more coherent. For example:
- Compare similar categories
- Discuss changes over time in chronological order
- Present contrasting information side by side
4. Use Appropriate Language
Employ a variety of vocabulary and grammatical structures to describe the data accurately. Some essential language skills include:
- Comparative and superlative forms
- Phrases for describing trends (e.g., “steady increase,” “sharp decline”)
- Adverbs of degree (e.g., “significantly,” “marginally”)
- Passive voice for objective descriptions
Common Pitfalls to Avoid
When interpreting data for IELTS Writing Task 1, be careful to avoid these common mistakes:
-
Overinterpreting the data: Stick to the information provided and avoid making assumptions or drawing conclusions beyond what is shown.
-
Neglecting the overview: Always include a clear overview paragraph summarizing the main trends or features of the visual aid.
-
Describing every data point: Focus on the most significant information rather than attempting to mention every single detail.
-
Using personal opinions: IELTS Writing Task 1 requires objective description, so avoid including your own views or explanations for the data.
-
Insufficient paraphrasing: While you should use your own words, make sure your paraphrasing accurately reflects the original information.
Practice Exercises for Improving Data Interpretation Skills
To enhance your ability to interpret data effectively, try these practice exercises:
-
Timed analysis: Set a timer for 2-3 minutes and practice quickly identifying the main trends and key features of various charts and graphs.
-
Comparison practice: Find two related graphs or charts and practice comparing and contrasting the information they present.
-
Language drills: Create a list of common data description phrases and practice using them in different contexts.
-
Mock tests: Regularly complete full IELTS Writing Task 1 practice tests under timed conditions to simulate the exam experience.
-
Peer review: Exchange your written responses with a study partner or tutor for feedback on your interpretation and language use.
By consistently applying these strategies and practicing regularly, you’ll develop the skills necessary to interpret data accurately and effectively in IELTS Writing Task 1. Remember, the key to success lies in clear, concise, and well-organized responses that demonstrate your ability to analyze and communicate complex information.