The IELTS Writing Task 1 often presents visual data, requiring test-takers to showcase their analytical and descriptive writing skills. Among the common themes, “Annual Rainfall in Major Cities” frequently appears, demanding an understanding of data trends, vocabulary, and grammatical structures. This article will delve into this topic, offering a comprehensive guide on how to effectively tackle such tasks and achieve a band score of 7 or higher.
Sample Task
You should spend about 20 minutes on this task.
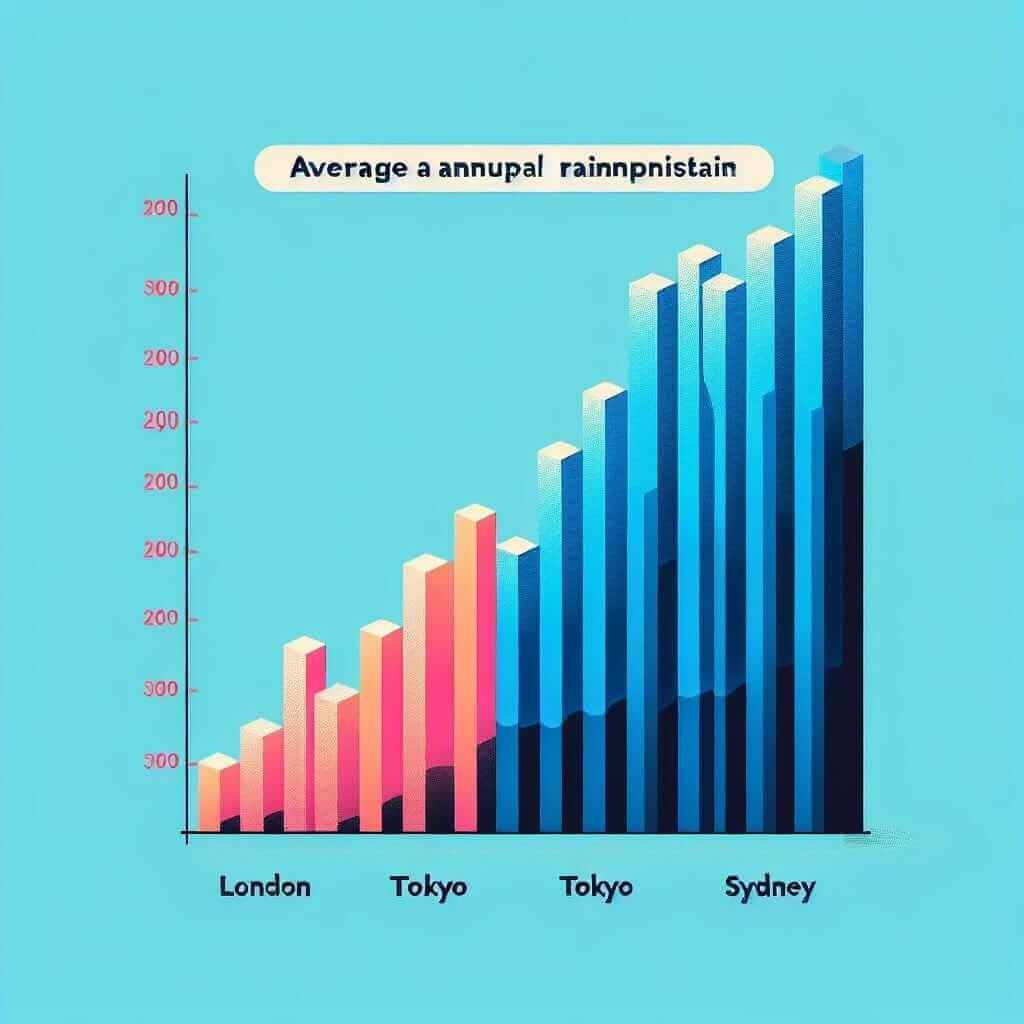
The chart below shows the average annual rainfall (in millimetres) in three major cities from 2000 to 2020.
Summarise the information by selecting and reporting the main features, and make comparisons where relevant.

Analysis of the Task
The task requires you to describe a bar chart that illustrates the average annual rainfall in three cities over two decades. You are expected to:
- Identify the main trends: For example, are there any significant increases or decreases in rainfall over the period? Which city generally receives the most/least rainfall?
- Compare and contrast: How do the rainfall patterns in the three cities compare? Are there any similarities or differences?
- Report the data accurately: Use figures from the chart to support your descriptions.
Model Answer
The bar chart illustrates the average yearly rainfall in millimetres for London, Tokyo, and Sydney between 2000 and 2020. Overall, London consistently experienced the lowest rainfall, while Tokyo generally received the highest.
London’s annual rainfall remained relatively stable over the two decades, fluctuating between 580mm and 620mm. Sydney showed more variation, with rainfall ranging from a low of around 550mm in 2018 to a high of approximately 750mm in 2010.
Tokyo, on the other hand, consistently experienced the most substantial rainfall, exceeding 1400mm every year. Although rainfall in Tokyo peaked at around 1800mm in 2014, it then showed a decreasing trend, reaching its lowest point of the period in 2020 at about 1450mm.
In conclusion, while London maintained consistently low rainfall and Tokyo remained the wettest city, Sydney displayed the most significant fluctuations in annual rainfall throughout the period.
(Word count: 158 words)
Key Points to Remember
- Paraphrase the question: Don’t just copy the wording; use synonyms and different sentence structures.
- Focus on overview and trends: Don’t simply list data; identify the key patterns and changes.
- Use appropriate vocabulary: Employ words like “increase,” “decrease,” “fluctuate,” “peak,” “trend,” and “plateau” to describe the data effectively.
- Be accurate with data: Use figures from the chart to support your statements.
- Use clear and concise language: Avoid overly complex sentences or jargon.
- Proofread carefully: Check for grammar, spelling, and punctuation errors.
Vocabulary Builder
- Fluctuate (verb) /ˈflʌktʃueɪt/: To rise and fall irregularly in number or amount.
- Substantial (adjective) /səbˈstænʃəl/: Large in size, value, or importance.
- Exceed (verb) /ɪkˈsiːd/: Be greater in number or size than (a quantity, number, or other measurable thing).
- Peak (noun) /piːk/: The highest point of something.
- Trend (noun) /trɛnd/: A general direction in which something is developing or changing.
- Plateau (noun) /ˈplætəʊ/: A state of little or no change following a period of activity or progress.
- Consistently (adverb) /kənˈsɪstəntli/: In every case or on every occasion; invariably.
- Variation (noun) /ˌveəriˈeɪʃən/: A change or difference in condition, amount, or level.
- Range (verb) /reɪndʒ/: Vary or extend between specified limits.
- Approximately (adverb) /əˈprɒksɪmətli/: Used to show that something is almost, but not completely, accurate or exact; roughly.
Conclusion
Mastering the art of describing visual data like “Annual Rainfall in Major Cities” is essential for achieving a high band score in the IELTS Writing Task 1. By focusing on accurate data representation, clear analysis, and appropriate vocabulary, you can effectively demonstrate your writing prowess and boost your overall IELTS score. Remember to practice regularly, analyze sample answers, and familiarize yourself with common IELTS themes to excel in this section.