Understanding commute times in major cities is a relevant and important topic in modern urban studies. The IELTS exam frequently includes such topics in Writing Task 1, challenging examinees to interpret and describe data presented in charts, graphs, or tables. In this article, we will delve into the topic of average commute times, analyze sample data, and create a comprehensive IELTS Task 1 response. We will also discuss essential vocabulary and grammatical structures to help you achieve a high band score.
Suggested IELTS Task 1 Prompts
Given the keyword “Average Commute Time in Major Cities (2000-2023),” here are some example prompts you might encounter in the IELTS exam:
- The following chart shows the average commute times of workers in five major cities from the year 2000 to 2023. Summarize the information by selecting and reporting the main features and make comparisons where relevant.
- The table below illustrates the average time people spent commuting in four different cities over the years 2000, 2010, 2020, and 2023. Summarize the information by selecting and reporting the key features and make comparisons where relevant.
- The graph shows the changes in average commute times in three major metropolitan areas between 2000 and 2023. Summarize the information by describing the main trends and making comparisons where appropriate.
Example Prompt:
Let’s choose the first prompt for our detailed analysis and response.
Prompt: The following chart shows the average commute times of workers in five major cities from the year 2000 to 2023. Summarize the information by selecting and reporting the main features and make comparisons where relevant.
Data Interpretation
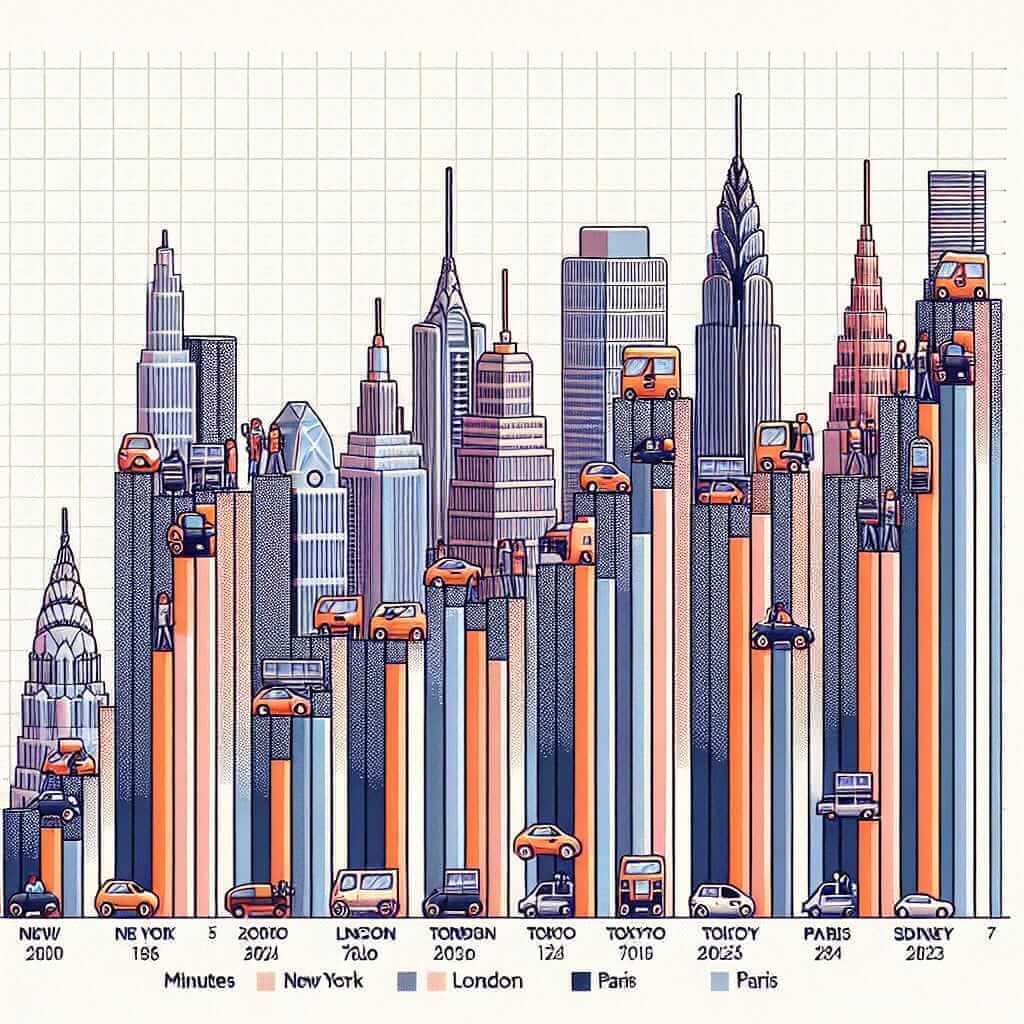
Below is an illustrative chart showing the average commute times (in minutes) from the year 2000 to 2023 for five major cities: New York, London, Tokyo, Paris, and Sydney.
| Year | New York | London | Tokyo | Paris | Sydney |
|---|---|---|---|---|---|
| 2000 | 40 | 30 | 25 | 35 | 33 |
| 2005 | 42 | 32 | 27 | 37 | 34 |
| 2010 | 45 | 34 | 28 | 39 | 36 |
| 2015 | 47 | 36 | 30 | 40 | 35 |
| 2020 | 48 | 40 | 32 | 42 | 37 |
| 2023 | 50 | 42 | 35 | 45 | 38 |

Analysis of the Prompt
To effectively summarize the chart, we should identify the key trends and significant features:
- Observing general trends in commute times across the years.
- Noting which cities have the longest and shortest commute times.
- Comparing the rate of increase or decrease over the given period.
IELTS Writing Task 1 Sample Response
The bar chart illustrates the average commute times (in minutes) for workers in five major cities—New York, London, Tokyo, Paris, and Sydney—over a span of 23 years from 2000 to 2023.
Overall, the data reveals a consistent increase in commute times across all cities. New York had the highest average commute time throughout the period, starting at 40 minutes in 2000 and rising steadily to reach 50 minutes by 2023. Similarly, London saw a significant rise from 30 minutes to 42 minutes, making it one of the cities with the steepest increase in commute durations.
Tokyo experienced the least amount of increase among the five cities, starting at 25 minutes in 2000 and gradually climbing to 35 minutes in 2023. Paris and Sydney also showed a consistent upward trend, with Paris rising from 35 to 45 minutes and Sydney from 33 to 38 minutes over the same period.
In comparing the cities, Tokyo had the shortest average commute times in 2023, whereas New York’s workers faced the longest commutes. Despite the differences in duration, it is evident that the average time spent on commuting has grown in all surveyed cities, indicating a global trend of increasing commute times.
Total words: 191
Key Considerations for Writing
Vocabulary and Grammar Tips
- Vocabulary Inclusion: Use terms like “illustrates,” “reveals,” “consistent increase,” “steepest increase,” “least amount of increase,” “upward trend,” “climbing,” and “surveyed cities.”
- Grammar Focus: Ensure the use of comparative and superlative adjectives (e.g., “longest,” “shortest,” “steepest”), appropriate prepositions (e.g., “over a span of,” “from…to…”), and past and present perfect tenses for trends analysis (e.g., “has grown,” “experienced”).
Key Vocabulary
- Illustrates (verb) /ˈɪləˌstreɪts/: Shows or explains something through a visual representation.
- Consistent (adjective) /kənˈsɪstənt/: Showing steadiness and regularity over time.
- Trend (noun) /trɛnd/: A general direction in which something is developing or changing.
- Climb (verb) /klaɪm/: To increase gradually over a period.
- Comparative (adjective) /kəmˈpærətɪv/: Involving comparison between two or more elements.
Conclusion
Writing a successful IELTS Task 1 response involves clear identification and summarization of key trends and comparative features. Remember to employ varied vocabulary and correct grammatical structures. By practicing with topics such as average commute times in major cities, you can enhance your ability to perform well in the exam and achieve your desired band score. Good luck!