As an experienced IELTS instructor, I’d like to share insights into the IELTS Writing Task 1, specifically focusing on analyzing and writing about topics such as “Average Daily Commute Time in Various Cities (2000-2023).” Understanding how to effectively interpret and describe data is crucial for achieving a high band score. In this article, we will:
- Examine potential IELTS Writing Task 1 topics related to “Average Daily Commute Time in Various Cities (2000-2023).”
- Analyze actual data.
- Create a model answer.
- Highlight important vocabulary and grammatical structures that will help enhance your writing.
Potential IELTS Writing Task 1 Topics
In recent years, questions about commuting times have occasionally appeared in the IELTS exam. Here are three hypothetical topics related to average daily commute times:
- The bar chart below shows the average daily commute time in five different cities from 2000 to 2023.
- The line graph below illustrates the trend in average daily commute times in four major cities between 2000 and 2023.
- The table below compares the average daily commute time in ten different cities in the years 2000 and 2023.
Selected Topic and Data Presentation
For this exercise, we will focus on the following bar chart:
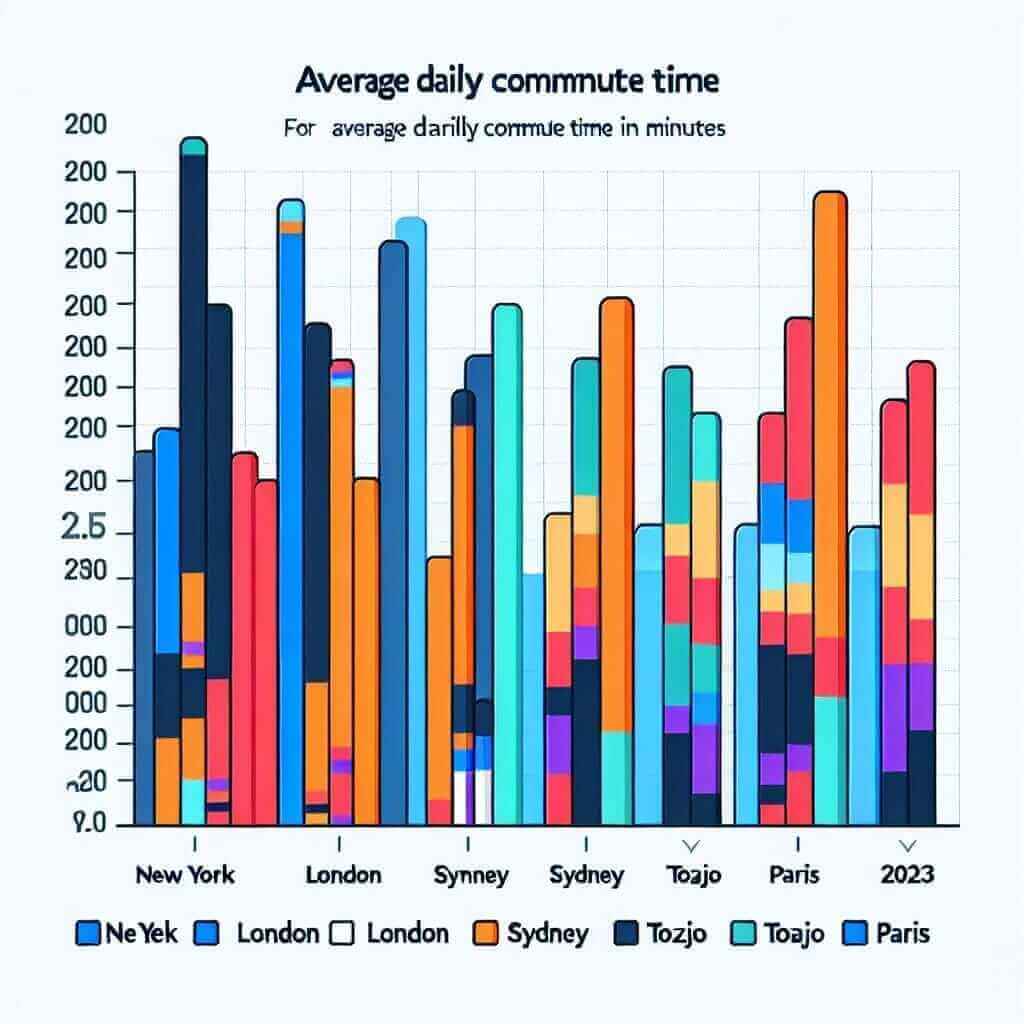
The bar chart below shows the average daily commute time in five different cities (New York, London, Sydney, Tokyo, and Paris) in the years 2000, 2010, and 2023.

Average Daily Commute Time (minutes)
| City | 2000 | 2010 | 2023 |
|---|---|---|---|
| New York | 45 | 50 | 55 |
| London | 40 | 42 | 48 |
| Sydney | 30 | 32 | 35 |
| Tokyo | 25 | 28 | 30 |
| Paris | 35 | 38 | 40 |
Analyzing the Topic
Key Points:
- The bar chart provides average daily commute times in minutes for New York, London, Sydney, Tokyo, and Paris in three distinct years: 2000, 2010, and 2023.
- Key trends must be identified, such as which city experienced the highest increase or decrease in commute times over the three years.
Model Answer
The bar chart illustrates the average daily commute time in minutes for five major cities—New York, London, Sydney, Tokyo, and Paris—over three years: 2000, 2010, and 2023.
Overall, it is evident that all cities observed an increase in commute times over the period. New York had the highest commute time in all three years, starting at 45 minutes in 2000 and rising to 55 minutes by 2023. In contrast, Tokyo had the shortest commute time among the five cities, increasing modestly from 25 minutes in 2000 to 30 minutes in 2023.
London and Paris experienced similar growth patterns. London’s average commute time rose from 40 minutes in 2000 to 48 minutes in 2023, while Paris saw an increase from 35 to 40 minutes over the same period. Sydney’s commute time, although consistently lower than that of New York and London, also increased, from 30 minutes in 2000 to 35 minutes in 2023.
In summary, the data shows a clear upward trend in commute times for all the cities from 2000 to 2023. This indicates a general trend towards longer daily commutes over the years, with New York consistently having the longest average commute time.
Word count: 198 words.
Tips on Writing
Vocabulary and Grammar Points
-
Comparison Structures:
- Use phrases like “the highest,” “the shortest,” “similar growth patterns,” and “an increase from A to B.”
- Example: “London and Paris experienced similar growth patterns.”
-
Describing Trends:
- Use verbs like “increase,” “rise,” “grow,” “remain steady,” and “drop.”
- Example: “All cities observed an increase in commute times over the period.”
-
Year Expressions:
- Phrases to denote time periods: “over the period,” “from A to B,” “by [year].”
- Example: “from 35 minutes in 2000 to 40 minutes in 2023.”
Important Vocabulary
- Commute (noun) – /kəˈmjuːt/: A regular journey to and from one’s place of work.
- Consistently (adverb) – /kənˈsɪstəntli/: In every case or on every occasion.
- Upward Trend (noun phrase): An increase over time.
- Peak (noun) – /piːk/: The highest point.
- Modestly (adverb) – /ˈmɒdɪstli/: To a moderate or small extent.
Conclusion
Mastering the description of data in IELTS Writing Task 1 is crucial for achieving a high band score. By focusing on key trends, utilizing appropriate vocabulary, and structuring your answer logically, you can effectively describe and interpret various types of data. Practice regularly with different types of charts and tables, and remember to review your grammar and vocabulary to ensure precision and clarity. Aim for coherence and cohesion to achieve a band 7+ score.