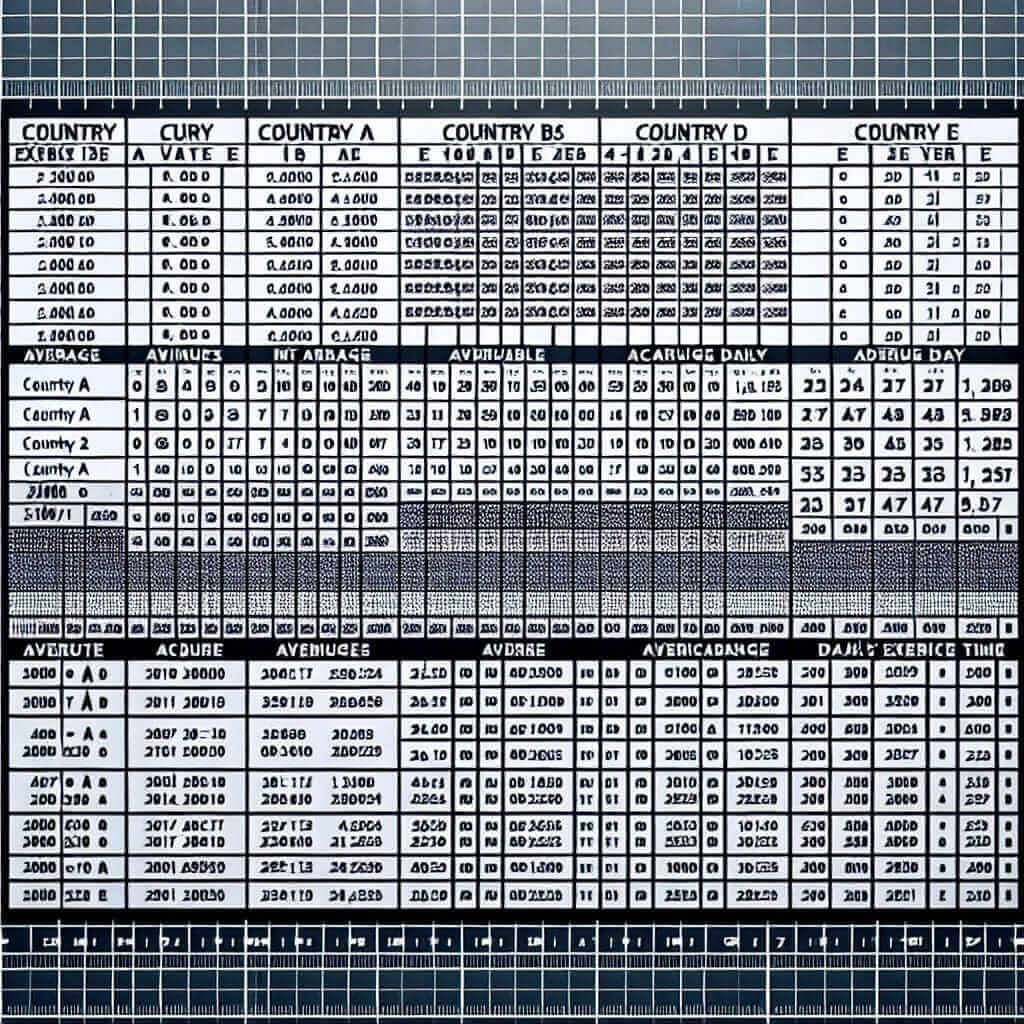
When preparing for the IELTS Writing Task 1, it’s crucial to be familiar with analyzing and describing statistical data. One common type of question involves interpreting graphs or charts related to various topics, such as “Average Daily Exercise Time in Various Countries (2000-2023)”. In this article, we will explore how to effectively approach this type of question, analyze a sample task, and provide a model answer. We will also highlight important vocabulary and grammar to help you achieve a high band score.
Common IELTS Writing Task 1 Topics
The topic “Average Daily Exercise Time in Various Countries (2000-2023)” has appeared multiple times in past IELTS exams, usually in the form of line graphs, bar charts, or tables. Here are some example tasks related to this topic:
- A line graph showing the average daily exercise time in various countries from 2000 to 2023.
- A bar chart comparing the average daily exercise time in different countries for specific years within the range of 2000 to 2023.
- A table displaying the average daily exercise time in various countries in 2000, 2010, and 2023.
For this article, we will create our own set of data to explore how to analyze and write about it.
Choosing a Sample Task
Let’s choose the following sample task for our model answer:
Sample Task: The table below shows the average daily exercise time (in minutes) for adults in five different countries in the years 2000, 2010, and 2023.
Country | 2000 | 2010 | 2023
----------------------------
Country A | 45   | 50   | 60
Country B | 30   | 35   | 40
Country C | 20   | 25   | 30
Country D | 25   | 20   | 15
Country E | 10   | 15   | 20
Analyzing the Task
Before we begin writing, it’s important to analyze the task and understand the data presented. Here are some key points to consider:
- Compare the average daily exercise times across different years for each country.
- Identify trends, such as increases or decreases in exercise time.
- Note any significant differences between the countries.
Writing the Model Answer
Introduction
In the IELTS Writing Task 1, always start with a clear introduction that paraphrases the task.
Introduction Example:
The table illustrates the average daily exercise time in minutes for adults in five different countries (A, B, C, D, and E) over the years 2000, 2010, and 2023.
Overview
Next, provide an overview of the most noticeable trends or patterns in the data. This is crucial for a high band score.
Overview Example:
Overall, it can be observed that countries A, B, and C saw a steady increase in exercise time over the 23-year period, while country D experienced a decline. Country E had the lowest exercise times, though it showed gradual improvement.
Detailed Analysis
Go into more detail about the data, breaking it down by country and year. Use appropriate vocabulary and grammar structures.
Detailed Analysis Example:
In the year 2000, country A had an average daily exercise time of 45 minutes, which rose to 50 minutes in 2010 and further to 60 minutes by 2023. Similarly, country B showed a gradual increase from 30 minutes in 2000 to 35 minutes in 2010, finally reaching 40 minutes in 2023. Country C followed a comparable pattern, starting at 20 minutes in 2000, increasing to 25 minutes in 2010, and attaining 30 minutes in 2023.
Conversely, country D exhibited a decreasing trend, with exercise time dropping from 25 minutes in 2000 to 20 minutes in 2010, and further declining to 15 minutes in 2023. Country E, while starting with the lowest exercise time of 10 minutes in 2000, showed a notable improvement, increasing to 15 minutes in 2010 and 20 minutes by 2023.
Summary
Conclude by summarizing the key trends again, ensuring you cover all the important points.
Summary Example:
In summary, the table reveals varied trends in average daily exercise time across the five countries from 2000 to 2023, with most countries showing improvement except for country D, which experienced a decline.
Word Count: 256
Key Considerations When Writing
Vocabulary and Grammar Tips
-
Use Comparative and Superlative Adjectives:
- Example: “Country A had the highest exercise time, while country E showed the lowest.”
-
Use Linking Words to Show Trends:
- Example: “Similarly,” “Conversely,” “In addition,” “However”
-
Passive Voice and Complex Sentences:
- Example: “Over the given period, the exercise time was increased by 15 minutes.”
-
Time Expressions:
- Example: “Over the 23-year period,” “By 2023”
Vocabulary to Remember
- Illustrate (verb): [ɪˈlʌstreɪt] – Make clear by using examples or charts.
- Trend (noun): [trɛnd] – A general direction in which something is developing or changing.
- Notable (adjective): [ˈnoʊtəbl] – Worthy of attention or notice; remarkable.
- Gradual (adjective): [ˈɡrædʒuəl] – Taking place, changing, moving, etc., by small degrees or little by little.
- Steady (adjective): [ˈstɛdi] – Firmly fixed, constant, not wavering.
- Decline (verb): [dɪˈklaɪn] – Decrease in power, value, or quantity.
- Conversely (adverb): [ˈkɒnvɜːsli] – Introducing a statement or idea which reverses one that has just been made or referred to.
- Average (noun): [ˈævərɪdʒ] – The result obtained by adding several quantities together and then dividing by the number of quantities.
- Minute (noun): [ˈmɪnɪt] – A period of time equal to sixty seconds or a sixtieth of an hour.
- Period (noun): [ˈpɪəriəd] – A length or portion of time.
Conclusion
When preparing for the IELTS Writing Task 1, understanding how to analyze and describe data accurately is key to achieving a high band score. Practice with topics like “Average Daily Exercise Time in Various Countries (2000-2023)”, and focus on using appropriate vocabulary and grammar to describe trends and comparisons effectively. By doing so, you will improve your chances of attaining a Band 7+ in your IELTS exam.