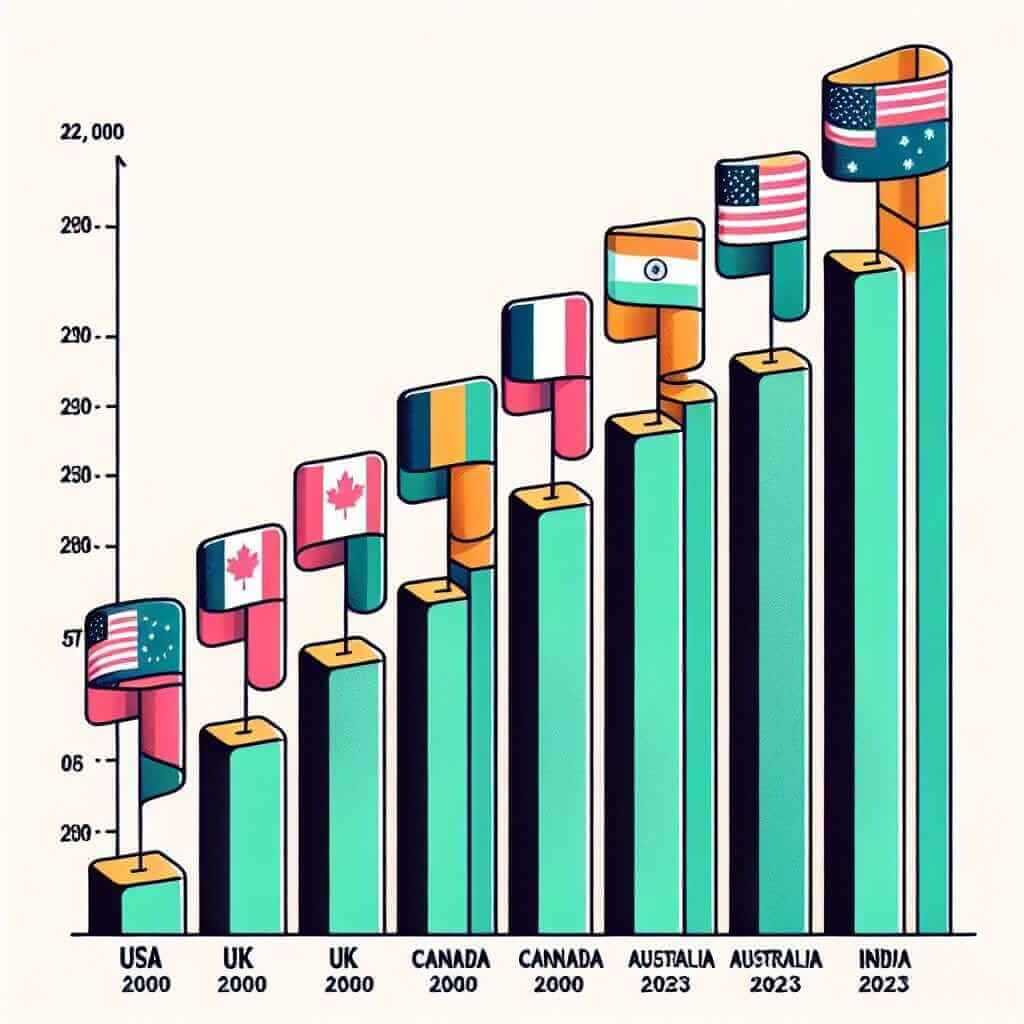
Analyzing data about the “Average Daily Screen Time in Various Countries (2000-2023)” is a popular theme in IELTS Writing Task 1. Understanding how to handle such data can help you achieve a higher score. In this guide, we will examine this topic in detail, providing you with sample questions, detailed analysis, and a sample response to help you excel in your writing task.
Possible IELTS Writing Task 1 questions:
- “The bar chart below shows the average daily screen time in hours across different countries from 2000 to 2023. Summarize the information by selecting and reporting the main features, and make comparisons where relevant.”
- “The table below illustrates the average daily screen times in various countries covering the period from 2000 to 2023. Summarize the data by identifying and comparing the significant trends.”
- “The line graph below represents the changes in average daily screen time in several countries between 2000 and 2023. Summarize the information by selecting and reporting the key details and comparing the changes over the period.”
Choosing a Sample Question
For this guide, we will create a sample response for the first question type: a bar chart that illustrates the average daily screen time (in hours) in various countries between 2000 and 2023.
Sample Data for Bar Chart
To provide a realistic sample response, we have created the following fictional data set for the bar chart:
| Country | 2000 | 2005 | 2010 | 2015 | 2020 | 2023 |
|---|---|---|---|---|---|---|
| USA | 4.2 | 4.7 | 5.0 | 5.2 | 5.5 | 5.7 |
| UK | 3.6 | 4.1 | 4.3 | 4.5 | 4.8 | 5.0 |
| Canada | 3.8 | 4.0 | 4.3 | 4.5 | 4.9 | 5.1 |
| Australia | 3.5 | 3.7 | 4.0 | 4.2 | 4.5 | 4.7 |
| India | 2.8 | 3.0 | 3.2 | 3.6 | 4.0 | 4.3 |

Analyzing the Question
The bar chart question requires you to summarize the information by selecting and reporting the main features and making comparisons where relevant. Key elements to note in the provided data include overall trends, differences between countries, and significant changes over time.
Sample Response
Sample IELTS Writing Task 1 Response
The bar chart provided illustrates the average daily screen time in hours for five countries (USA, UK, Canada, Australia, and India) spanning from 2000 to 2023.
Overall, the data reveals a clear upward trend in screen time across all the countries mentioned, with the USA consistently having the highest average daily screen time and India the lowest. The incremental increase in screen usage is notable across all countries, reflecting a global rise in technology and screen dependence.
In 2000, the average daily screen time in the USA was 4.2 hours, which gradually increased to 5.7 hours by 2023, marking a significant rise of 1.5 hours over the period. Similarly, the UK started at 3.6 hours in 2000 and increased steadily to 5.0 hours in 2023. Canada saw a comparable increase from 3.8 hours in 2000 to 5.1 hours in 2023.
Australia began with an average screen time of 3.5 hours per day in 2000, rising to 4.7 hours by 2023. India’s screen time, while lower than the other countries, showed a significant upward trend from 2.8 hours in 2000 to 4.3 hours in 2023.
In conclusion, the data indicates that while all countries exhibited an increase in average daily screen time, the USA consistently recorded the highest usage. Furthermore, the growth rate of screen time from 2000 to 2023 highlights the expanding role of electronic screens in daily life.
Word count: 210
Notes for Writing
Vocabulary and Grammar Tips
Vocabulary:
- Incremental (adj): increasing gradually by regular amounts (Example: The incremental increase in screen usage is notable across all countries.)
- Consistent (adj): remaining the same over a period of time (Example: The USA consistently recorded the highest average daily screen time.)
- Global (adj): relating to the whole world (Example: Reflecting a global rise in technology and screen dependence.)
- Significant (adj): sufficiently great or important to be worthy of attention (Example: Marking a significant rise of 1.5 hours over the period.)
Grammar:
- Use of past tense to describe historical data: “started,” “increased,” “rose.”
- Comparative structures: “higher than,” “lower than,” “comparable increase.”
- Use of passive voice for general trends: “The incremental increase in screen usage is notable across all countries.”
Important Vocabulary
- Incremental (adj) /ˌɪŋkrɪˈmɛntl/
- Consistent (adj) /kənˈsɪstənt/
- Global (adj) /ˈɡloʊbl/
- Significant (adj) /sɪɡˈnɪfɪkənt/
- Steadily (adv) /ˈstɛdɪli/
- Gradually (adv) /ˈɡræʒʊli/
- Reflect (v) /rɪˈflɛkt/
- Exhibit (v) /ɪɡˈzɪbɪt/
- Consistently (adv) /kənˈsɪstəntli/
- Dependence (n) /dɪˈpɛndəns/
Conclusion
To achieve a high score in IELTS Writing Task 1, particularly when dealing with data such as “Average Daily Screen Time in Various Countries (2000-2023),” ensure you clearly identify trends, make relevant comparisons, and use accurate vocabulary and grammatical structures. Practice with various data sets and seek feedback to continuously improve your writing skills.