In recent years, the amount of time that individuals spend on social media has surged dramatically, becoming a prevalent topic of discussion and analysis. This topic frequently appears in the IELTS Writing Task 1 exam, where candidates may be required to describe and analyze data presented in charts, diagrams, or tables. To assist you in scoring higher in the IELTS exam, this guide will focus on the topic of “Average Daily Time Spent on Social Media (2000-2023)” and provide practical writing tips, examples, and vocabulary.
In this guide, we will cover:
- Creating sample questions related to “Average Daily Time Spent on Social Media (2000-2023)”
- Using real data to create a mock chart and perform a writing task analysis
- Providing a complete sample answer
- Highlighting key vocabulary and grammatical points
- Offering practical tips to enhance your writing skills
Sample Questions
To begin, let’s create some sample IELTS Writing Task 1 questions related to the average daily time spent on social media:
- The line graph below shows the average daily time spent on social media platforms from 2000 to 2023. Summarize the information by selecting and reporting the main features, and make comparisons where relevant.
- The bar chart illustrates the average daily time different age groups spent on social media from 2000 to 2023. Summarize the information by selecting and reporting the main features, and make comparisons where relevant.
- The pie charts below show the percentage of average daily time spent on different social media activities in 2005 and 2023. Summarize the information by selecting and reporting the main features, and make comparisons where relevant.
For this guide, we will use the first sample question for our detailed analysis and writing practice.
Real Data and Mock Chart
To create a realistic mock chart, we will use hypothetical data to simulate the trend:
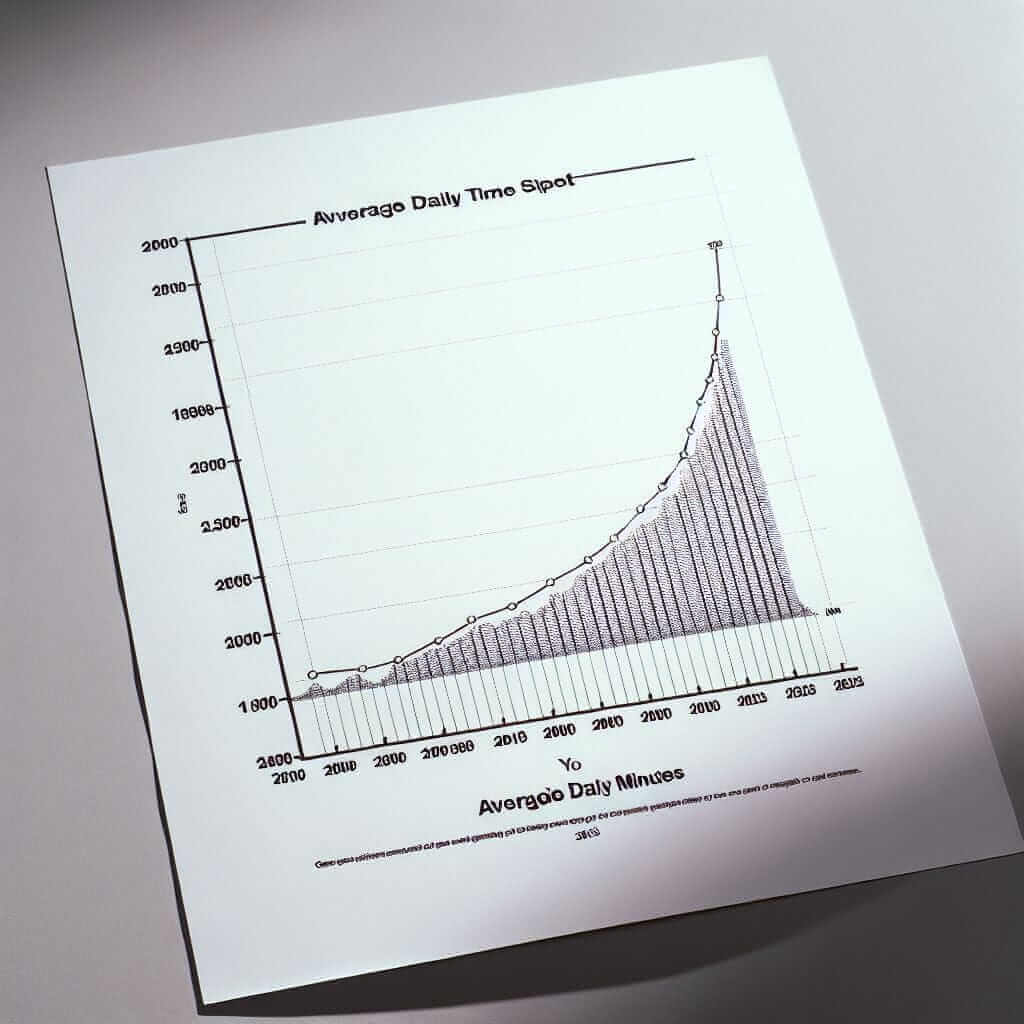
Mock Line Graph: Average Daily Time Spent on Social Media (2000-2023)
| Year | Minutes per Day |
|---|---|
| 2000 | 10 |
| 2005 | 25 |
| 2010 | 50 |
| 2015 | 90 |
| 2020 | 130 |
| 2023 | 150 |
 Average Daily Time Spent on Social Media (2000-2023)
Analyzing the Question
The question requires us to:
- Summarize the information.
- Report the main features.
- Make comparisons where relevant.
Key points to identify:
- Time frame: 2000 to 2023.
- The trend: Overall increase.
- Significant points: Notable increases in specific periods.
Sample Answer
Here is a sample answer following the structure and criteria needed for a high band score in IELTS Writing Task 1:
The line graph indicates the average daily time spent on social media from 2000 to 2023.
Overall, there is a clear upward trend in the time spent on social media over the 23-year period. In 2000, the average daily time was significantly low at just 10 minutes. This figure gradually increased to 25 minutes by 2005. The subsequent years saw a more marked rise, with the average time reaching 50 minutes per day by 2010, nearly double the 2005 figure.
The most prominent increase occurred between 2010 and 2015, where the average daily time surged from 50 minutes to 90 minutes. This trend continued, albeit at a slightly slower pace, with users spending an average of 130 minutes per day by 2020. By 2023, the average daily time peaked at 150 minutes, indicating a substantial growth of 140 minutes compared to the year 2000.
To summarize, the data shows a significant and continuous growth in the time individuals spend on social media, highlighting the increasing importance and influence of these platforms in daily life.
(Words: 174)
Key Vocabulary and Grammar
Vocabulary
- Upward trend (noun) /ˈʌpwərd trɛnd/: a general increase over time.
- Prominent (adjective) /ˈprɑːmɪnənt/: easily noticeable; significant.
- Surge (verb) /sɜrdʒ/: to increase quickly.
- Substantial (adjective) /səbˈstænʃəl/: large in amount or value.
- Peak (noun) /piːk/: the highest point or level.
Grammar Tips
- Use of Comparatives and Superlatives: “More marked rise,” “most prominent increase.”
- Past Simple and Present Perfect: Understanding when to use past simple (for completed actions) and present perfect (for actions that have relevance to the present).
Practical Writing Tips
- Identify Key Features: Look for overall trends, significant changes, and any anomalies.
- Time Management: Spend around 20 minutes on Task 1, ensuring you have enough time to plan, write, and review.
- Be Clear and Concise: Provide a clear summary without unnecessary details.
- Use Linking Words: Words like “overall,” “in contrast,” and “similarly” help make your writing coherent.
- Practice Regularly: Familiarize yourself with different types of charts and graphs to build confidence and skill.
Conclusion
Describing trends in social media usage can be challenging, but with careful analysis and structured writing, you can score high in the IELTS Writing Task 1. Remember to summarize the main features, make relevant comparisons, and practice using the appropriate vocabulary and grammar. By following these tips and analyzing the provided sample, you will be well-prepared to tackle similar topics in your IELTS exam, aiming for a Band 7+ score.


