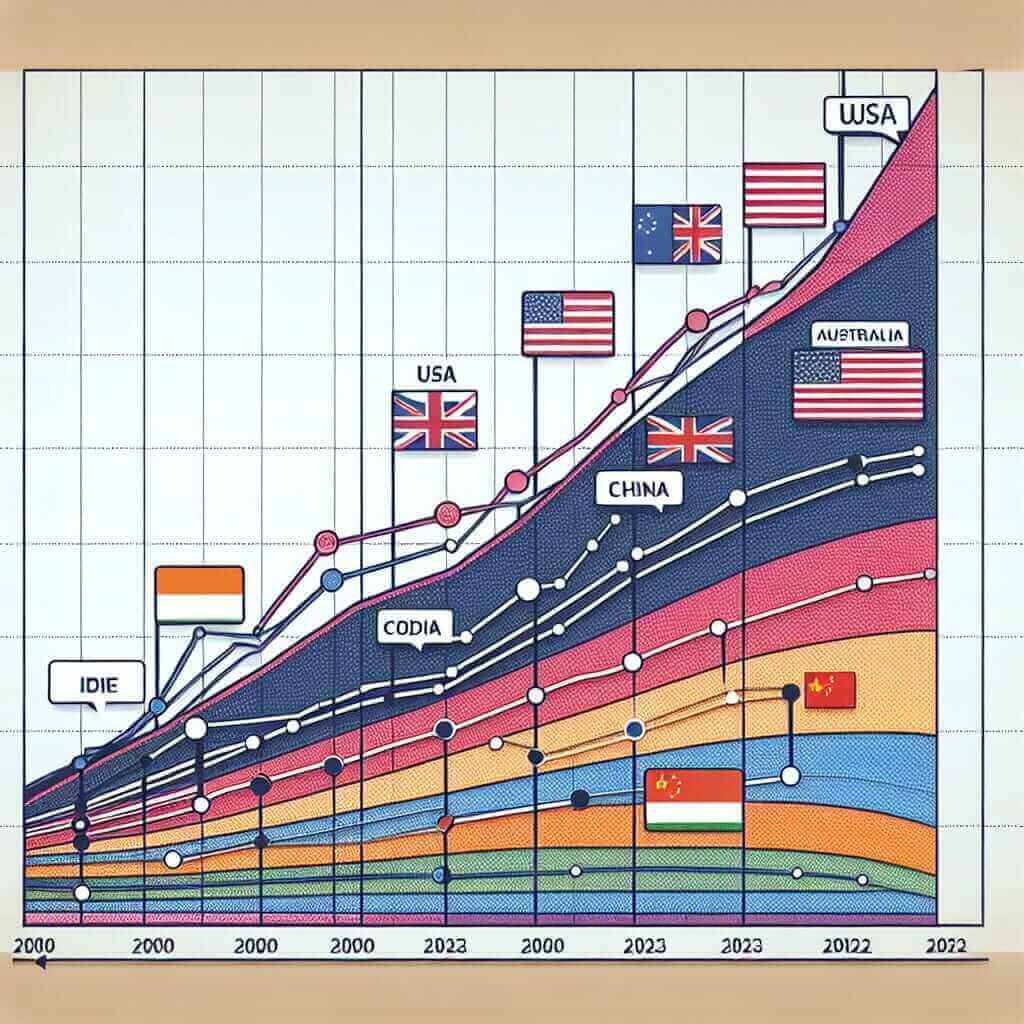
Social media usage has significantly offered new insights into modern communication patterns. The topic of average daily time spent on social media in different countries from 2000 to 2023 is pertinent and can often appear in the IELTS Writing Task 1. In this guide, we will explore how to effectively tackle such a topic in the writing section of the IELTS exam, offering tips and sample responses to help you excel.
## Sample Task: Average Daily Time Spent on Social Media
### Task Description
You should spend about 20 minutes on this task.
The table below shows the average daily time spent on social media in various countries from the year 2000 to 2023.
Summarize the information by selecting and reporting the main features and make comparisons where relevant.
**Average Daily Time Spent on Social Media (in minutes)**
| Year | USA | UK | Australia | China | India |
|—|—|—|—|—|—|
| 2000 | 20 | 25 | 15 | 10 | 12 |
| 2005 | 35 | 30 | 25 | 20 | 18 |
| 2010 | 50 | 45 | 35 | 30 | 25 |
| 2015 | 60 | 55 | 50 | 45 | 40 |
| 2023 | 80 | 75 | 65 | 60 | 55 |
Write at least 150 words.

## Analyzing the Question
When analyzing the given table, it’s essential to consider the following points:
1. **Overview:** Provide a brief overview of the general trend over the given period.
* What is the general trend across all countries?
* Identify which countries have the highest and lowest average daily times.
2. **Key Features:**
* Note specific values, particularly the largest and smallest figures in the dataset.
* Identify any unique trends or anomalies.
* Compare the figures between different years and countries.
3. **Comparative Analysis:** Discuss the similarities or differences between the countries and the changes over time.
## Sample IELTS Writing Task 1 Response
The table presents information on the average daily time spent on social media across five countries from 2000 to 2023. Overall, the data shows a consistent increase in social media usage in all the countries over the given period.
In 2000, the USA had an average daily social media usage of 20 minutes, which increased steadily to 80 minutes by 2023. Both the UK and Australia exhibited a similar rising trend, with the UK moving from 25 minutes to 75 minutes and Australia from 15 minutes to 65 minutes.
China and India also followed the upward trajectory, starting at lower figures. China had 10 minutes in 2000 and grew to 60 minutes by 2023, while India started from 12 minutes and peaked at 55 minutes in the same period.
Notably, the USA maintained the highest figures throughout the years, whereas China and India had the lowest until mid-period, with their numbers catching up gradually by 2023. A significant spike is observed in the data post-2010, indicating a more rapid adoption of social media during recent years.
In conclusion, social media engagement has substantially increased in all the countries from 2000 to 2023, with the USA consistently leading and China and India reflecting significant growth post-2010.
*(Word Count: 202)*
## Key Writing Tips for This Task
1. **Structure:**
* **Introduction:** Briefly introduce the table/data provided.
* **Overview:** Summarize the main trends or general overview of the data without delving into specific details.
* **Detailed Paragraphs:** Discuss the data points in more detail, offering comparisons and highlighting significant trends.
2. **Language and Vocabulary:**
* Use comparative statements: “more than”, “less than”, “while”, “whereas”, etc.
* Precise vocabulary: “increase,” “decrease,” “rise,” “fall,” “peak,” “low point.”
3. **Linking Words:** To ensure coherence and cohesion, use linking words effectively such as “however,” “moreover,” “consequently,” and “therefore.”
## Challenging Vocabulary and Phrases
1. **Trajectory (noun) /trəˈdʒɛktəri/** – the path followed by a projectile flying or an object moving under the action of given forces.
2. **Steadily (adverb) /ˈstɛdɪli/ **- in a regular and even manner.
3. **Adoption (noun) /əˈdɒpʃ(ə)n/ **- the action or fact of adopting or being adopted.
4. **Consistent (adjective) /kənˈsɪstənt/ **- acting or done in the same way over time, especially so as to be fair or accurate.
5. **Reflect (verb) /rɪˈflɛkt/ **- think deeply or carefully about.
## Conclusion
For an effective Band 7+ response on IETLS Writing Task 1 involving complex data like average daily time spent on social media, you should always structure your essay clearly, use precise vocabulary and linking words, and provide a detailed and comparative analysis. Remember to summarize the main features and trends while ensuring your response remains relevant and concise.