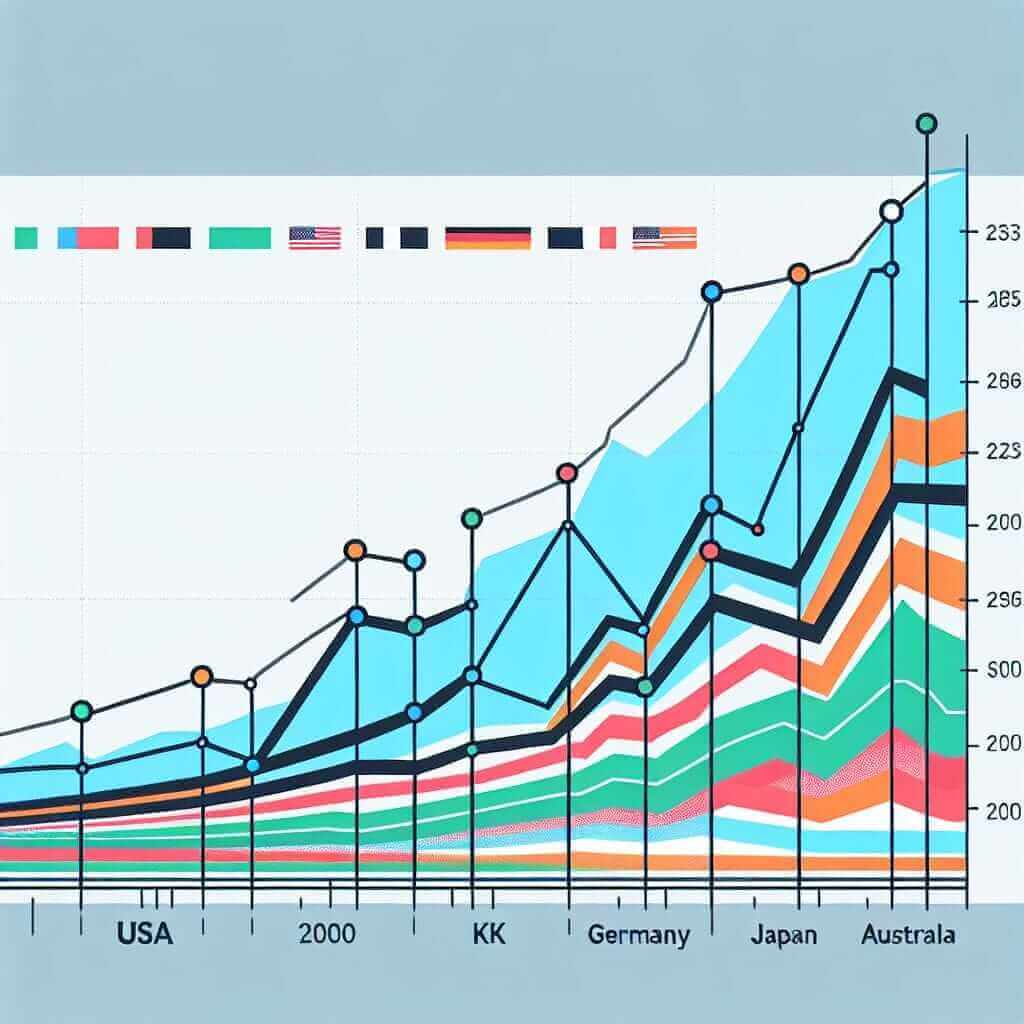
Understanding the “Average Daily Travel Time in Various Countries (2000-2023)” not only provides valuable insights into global commuting patterns but also serves as an excellent practice topic for IELTS Writing Task 1. As this topic reflects real-world data, it’s perfect for honing analytical and descriptive skills required for the exam.
Potential Task Prompts:
- “The graph below shows the average daily travel time in minutes per person in five different countries from 2000 to 2023.”
- “Summarize the information by selecting and reporting the main features, and make comparisons where relevant.”
- “Compare the changes in average daily travel time among various countries between 2000 and 2023.”
Selected Task Prompt
For this exercise, we’ll focus on the first task prompt: “The graph below shows the average daily travel time in minutes per person in five different countries from 2000 to 2023.”
Sample Data:
To create a realistic scenario, we’ll use fictional data for five countries: USA, UK, Germany, Japan, and Australia.
Average Daily Travel Time (Minutes)
| Year | USA | UK | Germany | Japan | Australia |
|---|---|---|---|---|---|
| 2000 | 40 | 35 | 30 | 50 | 45 |
| 2005 | 45 | 40 | 35 | 55 | 47 |
| 2010 | 50 | 38 | 37 | 60 | 49 |
| 2015 | 52 | 42 | 40 | 62 | 50 |
| 2020 | 55 | 44 | 42 | 65 | 53 |
| 2023 | 58 | 46 | 45 | 68 | 55 |

Analysis of the Prompt
In this task, you’re required to summarize and describe trends and compare the average daily travel time in various countries over the given period.
Sample Response
Let’s draft a model answer:
The line graph illustrates the average daily travel time per person in minutes across five countries (USA, UK, Germany, Japan, and Australia) between 2000 and 2023.
Overall, all countries experienced an increase in the average daily travel time over the period. Notably, Japan consistently recorded the highest daily travel time, while Germany had the lowest for the most part of the given years.
In 2000, Japan’s citizens spent the most time traveling daily at 50 minutes, significantly higher than the USA (40 minutes) and Australia (45 minutes). Meanwhile, Germany had the shortest travel time, averaging only 30 minutes per person, with the UK at 35 minutes.
By 2023, the USA’s travel time had risen to 58 minutes, surpassing Australia’s 55 minutes and closely following Japan’s 68 minutes. The UK and Germany also saw increases, reaching 46 and 45 minutes respectively, with Germany reflecting the slowest increase over the years.
A notable trend is the sharp rise in travel time in Japan, which peaked at 68 minutes in 2023. Similarly, the USA saw significant growth from 40 minutes in 2000 to 58 minutes by 2023. Conversely, Germany showed a more gradual increase, ending at 45 minutes in 2023.
In summary, although the average daily travel time increased in all five countries, Japan consistently had the highest figures, and Germany had the lowest, apart from the early 2000s.
Word Count: 225
Important Considerations for Writing
- Structure: Ensure to include an introduction, an overview, and body paragraphs that logically organize comparisons and trends.
- Tense: Primarily use past tense for describing trends.
- Comparative Vocabulary: Use terms such as “higher than,” “lower than,” “increased,” “decreased,” “peaked,” and “gradually/rise.”
Vocabulary and Grammar Tips
Key Vocabulary
- Illustrate (v) – /ˈɪləˌstreɪt/ – To show or explain something using examples, charts, etc.
- Consistently (adv) – /kənˈsɪstəntli/ – In a persistent manner, regularly.
- Peak (v) – /piːk/ – To reach the highest point or maximum.
- Notable (adj) – /ˈnoʊtəbl/ – Worthy of attention, significant.
- Gradual (adj) – /ˈɡrædʒuəl/ – Slowly developing, step-by-step change.
Grammar Focus
- Past Simple vs. Present Perfect: While describing changes over a period, past simple is often used, e.g., “The travel time in 2000 was…”, “By 2023, it had increased…”.
- Comparative Forms: Use greater, lesser, higher, lower, more significant, less significant to compare data.
Conclusion
Mastering IELTS Writing Task 1 requires the ability to analyze, describe, and compare data succinctly and clearly. Focus on structure, tense, and comparative vocabulary to articulate your observations effectively. Practicing with real-world data like the “Average Daily Travel Time in Various Countries (2000-2023)” will sharpen your skills for achieving a Band 7+ score.