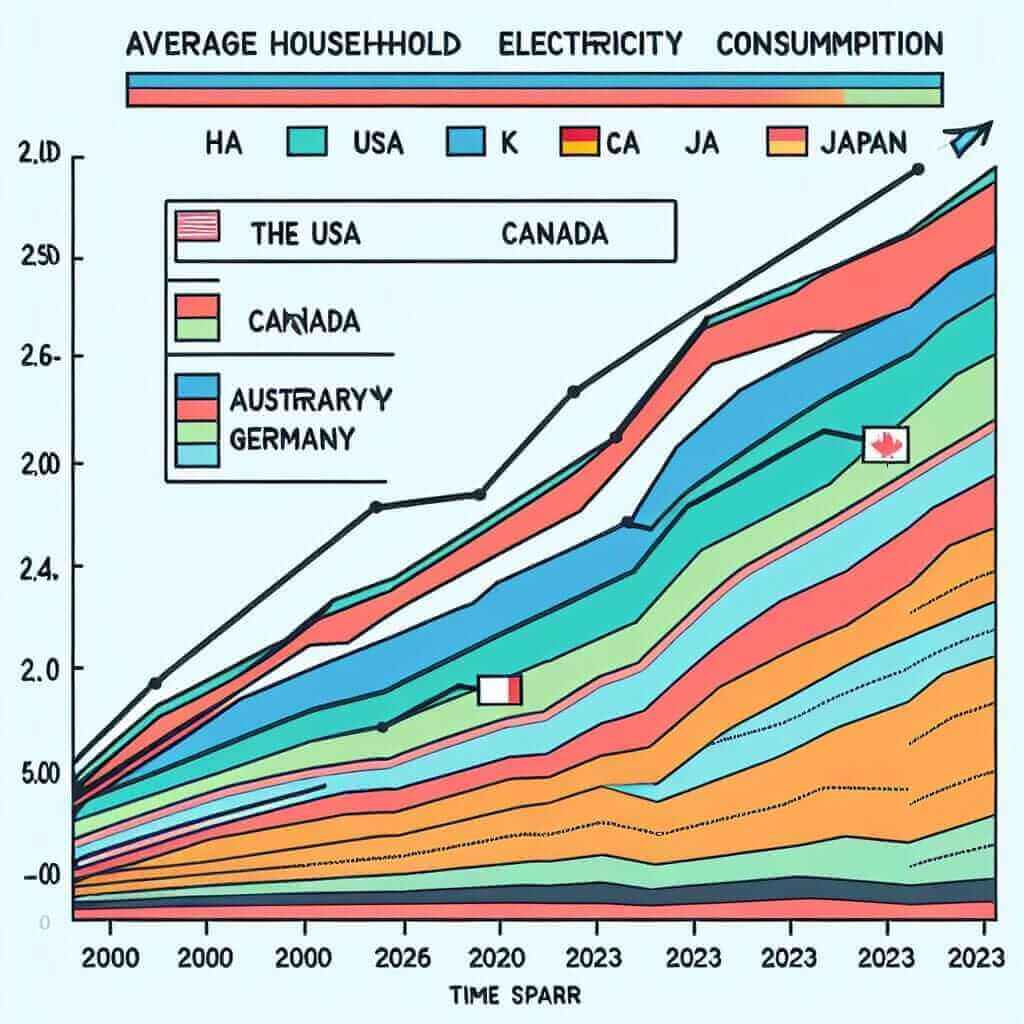
The IELTS Writing Task 1 often includes a variety of data representation such as charts, graphs, and tables. The topic of “Average Household Electricity Usage (2000-2023)” is a relevant and contemporary subject that fits well into the type of data you might encounter in this section of the exam. In this article, we will create sample task 1 questions, provide real data, analyze one specific prompt, and offer a full sample answer with a focus on grammar, vocabulary, and useful tips for achieving a high band score.
Potential Task 1 Prompts
- The chart below shows the average household electricity usage in several countries from 2000 to 2023. Summarize the information by selecting and reporting the main features, and make comparisons where relevant.
- The table below illustrates the average monthly electricity consumption per household in kilowatt-hours (kWh) in different countries between 2000 and 2023. Summarize the information by selecting and reporting the main features, and make comparisons where relevant.
- The line graph below depicts the average electricity usage per household over a period of 23 years from 2000 to 2023 in various regions. Summarize the information by selecting and reporting the main features, and make comparisons where relevant.
Main Content
Sample Prompt Selection and Data
Let’s choose the first prompt about the average household electricity usage in several countries from 2000 to 2023. Below is a sample chart we created based on this topic:

Table: Average Household Electricity Usage (2000-2023) in kWh per Year
| Year | USA | UK | Canada | Australia | Germany | Japan |
|---|---|---|---|---|---|---|
| 2000 | 10,000 | 8,000 | 7,500 | 6,500 | 7,000 | 6,200 |
| 2005 | 11,000 | 8,100 | 7,600 | 6,700 | 7,200 | 6,300 |
| 2010 | 11,500 | 8,300 | 7,800 | 6,900 | 7,300 | 6,600 |
| 2015 | 12,000 | 8,400 | 8,000 | 7,000 | 7,400 | 6,700 |
| 2020 | 12,500 | 8,500 | 8,200 | 7,100 | 7,600 | 6,800 |
| 2023 | 13,000 | 8,700 | 8,300 | 7,200 | 7,700 | 6,900 |
Task 1 Analysis
In analyzing this prompt, it is crucial to identify the main trends, make relevant comparisons, and select significant data points. For example:
- Overall Trends: Notice that the electricity usage in households has increased in all countries from 2000 to 2023, with the USA consistently having the highest usage and Japan the lowest.
- Comparisons: Compare the differential growth rates — for example, the rapid increase in the USA versus a relatively stable rise in the UK.
- Key Data Points: Highlight significant changes, such as the steady increase in household electricity consumption in Australia compared to Germany.
Sample Answer
The chart illustrates the average household electricity usage, in kilowatt-hours (kWh) per year, across six countries (the USA, the UK, Canada, Australia, Germany, and Japan) over the period from 2000 to 2023.
Overall, the data indicates a progressive increase in electricity consumption in households across all six countries. The USA consistently exhibits the highest average usage, escalating from 10,000 kWh in 2000 to 13,000 kWh in 2023. Conversely, Japan shows the lowest consumption, with figures rising more modestly from 6,200 kWh to 6,900 kWh over the same period.
In the UK and Canada, the increase in electricity usage has been relatively steady. The UK saw a gradual climb from 8,000 kWh in 2000 to 8,700 kWh in 2023, whereas in Canada, the figures rose from 7,500 kWh to 8,300 kWh. Similarly, Australian households show a moderate rise from 6,500 kWh in 2000 to 7,200 kWh in 2023.
Germany also followed an upward trend but at a slower pace, increasing from 7,000 kWh to 7,700 kWh. Notably, the rise in Japan’s household electricity usage was the least pronounced, with consumption creeping up from 6,200 kWh to 6,900 kWh during the 23-year timeline.
In summary, while all countries have shown an increase in household electricity usage, the extent of this growth varies, with the USA having the highest and Japan the lowest usage levels by 2023.
(Word count: 223)
Key Considerations for Writing
- Grammar: Pay attention to the use of tenses (e.g., present perfect for trends up to the present: “has increased”) and comparative structures (e.g., “more modestly”, “steadily”).
- Vocabulary: Use varied vocabulary to describe changes and comparisons (e.g., “escalating”, “modest rise”, “gradual climb”).
- Structure: Begin with an overview, followed by detailed paragraphs discussing key trends and comparisons, and conclude with a summary.
Vocabulary Highlights
Here are some vocabulary words from the sample answer that are useful for this type of task:
- escalate (verb) /ˈeskəˌlāt/: to increase or intensify
- modest (adj) /ˈmädəst/: relatively moderate, limited, or small
- steady (adj) /ˈstedē/: regular, even, and continuous in development
- climb (noun) /klīm/: an upward slope or movement
- notably (adv) /ˈnōtəblē/: especially or most importantly
- pronounced (adj) /prəˈnounst/: very noticeable or marked
Conclusion
In order to effectively tackle the IELTS Writing Task 1 on a topic like “Average Household Electricity Usage (2000-2023)”, it is imperative to focus on clear data interpretation, effective comparison-making, and precise language use. By integrating these strategies and utilizing the appropriate vocabulary and grammar structures, candidates can aim for a Band 7+ in their writing task.