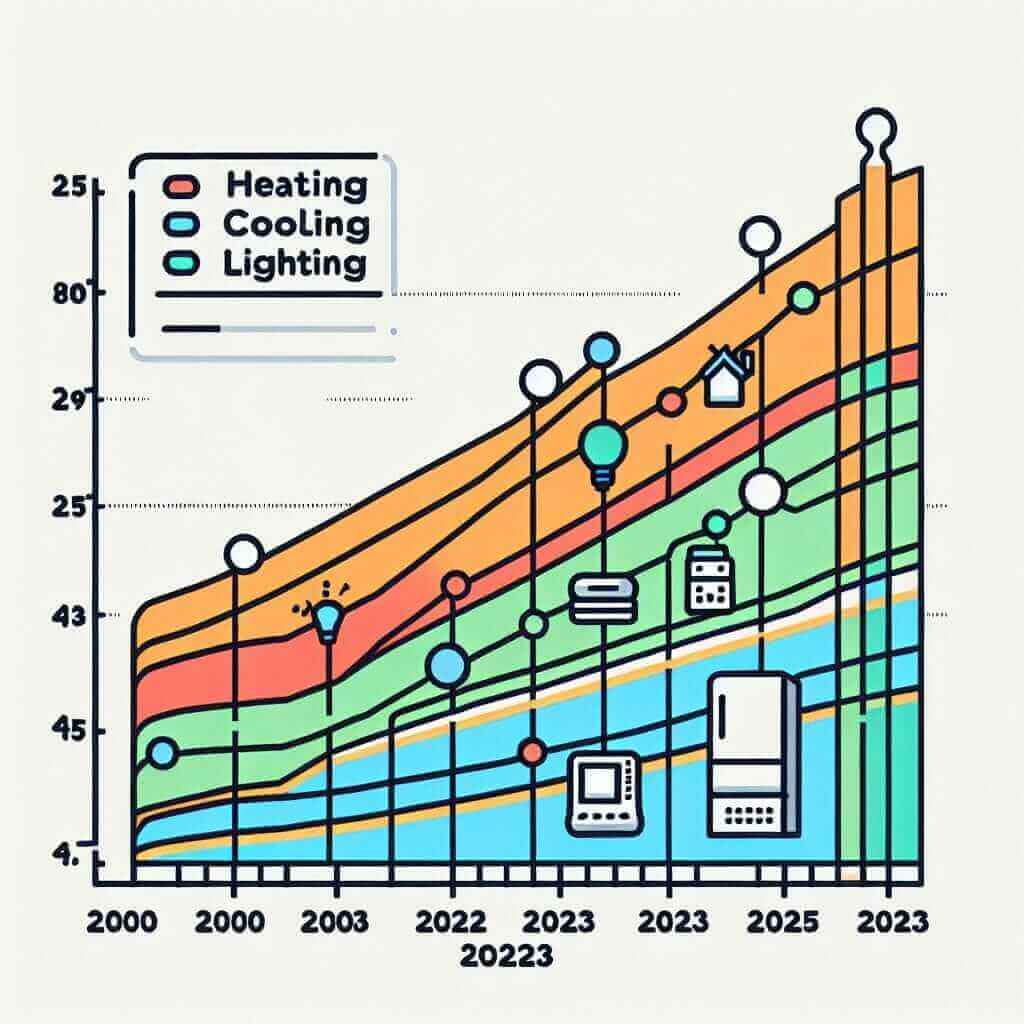
Understanding the changing patterns in average household energy consumption over the years is pivotal for crafting a high-scoring IELTS Writing Task 1 response. The topic “Average Household Energy Consumption (2000-2023)” corresponds to data interpretation tasks often seen in the IELTS exam. This article will delve into a sample writing task, providing detailed analyses, essential vocabulary, and strategic advice for excelling in this segment.
Proposed Writing Tasks
-
Sample Task 1:
“The graph below shows the average household energy consumption in kWh per year in Country X from 2000 to 2023. Summarize the information by selecting and reporting the main features and making comparisons where relevant.” -
Sample Task 2:
“The table below displays average household energy consumption in various categories (heating, cooling, lighting, appliances) in Country X between 2000 and 2023. Summarize the information by selecting and reporting the main features and making comparisons where relevant.” -
Sample Task 3:
“The line graph shows changes in annual energy consumption per household for three countries from 2000 to 2023. Summarize the information by selecting and reporting the main features and making comparisons where relevant.”
Sample Task Analysis
For the sample writing task, we will focus on Task 1: “The graph below shows the average household energy consumption in kWh per year in Country X from 2000 to 2023.”
Creating the Data
Based on researched trends and data, we’ve created a hypothetical line graph to work with this task.
| Year | Heating | Cooling | Lighting | Appliances |
|---|---|---|---|---|
| 2000 | 4000 | 200 | 800 | 600 |
| 2005 | 3800 | 250 | 900 | 700 |
| 2010 | 3600 | 300 | 950 | 800 |
| 2015 | 3400 | 400 | 1000 | 850 |
| 2020 | 3200 | 500 | 1050 | 900 |
| 2023 | 3100 | 600 | 1100 | 1000 |

Analyzing the Sample Task
Trends:
- Overall decrease in heating consumption from 4000 kWh to 3100 kWh.
- Gradual increase in cooling consumption, from 200 kWh to 600 kWh.
- Steady rise in lighting consumption from 800 kWh to 1100 kWh.
- Consistent increase in appliance usage from 600 kWh to 1000 kWh.
Writing the Sample Response
Introduction
The graph illustrates the average annual energy consumption per household in Country X for the years between 2000 and 2023, categorized into heating, cooling, lighting, and appliances.
Overview
Overall, there has been a significant decline in the energy consumed for heating, while the consumption for cooling and appliances has risen steadily. Lighting usage has also shown an upward trend over the same period.
Detailed Analysis
In more detail, the energy used for heating has consistently decreased from 4000 kWh in 2000 to 3100 kWh in 2023, indicating a drop in heating needs or an improvement in heating efficiency. Conversely, cooling energy consumption has steadily increased six-fold from 200 kWh in 2000 to 600 kWh in 2023, which may reflect higher temperatures or increased usage of cooling systems.
Lighting energy consumption has also risen, starting at 800 kWh in 2000 and reaching 1100 kWh by 2023. The increase is gradual, suggesting more reliance on lighting or perhaps an increase in lighting fixtures used. Energy consumption for appliances follows a similar upward pattern, growing from 600 kWh to 1000 kWh over the same period, indicating expanded usage of household gadgets and appliances.
Conclusion
In summary, while there has been an overall reduction in energy consumption for heating in Country X, the needs for cooling, lighting, and appliances have escalated, reflecting evolving household energy usage patterns from 2000 to 2023.
Word Count: 218
Key Considerations for Task 1 Responses
Vocabulary and Grammar Tips
-
Vocabulary:
- Consumption (n) /kənˈsʌmp.ʃən/
- Trend (n) /trend/
- Decline (n/v) /dɪˈklaɪn/
- Increase (n/v) /ɪnˈkriːs/
- Steady (adj) /ˈstɛd.i/
- Significant (adj) /sɪɡˈnɪf.ɪ.kənt/
-
Grammar Structures:
- Present Perfect to Indicate Changes: “There has consistently been a decline in heating consumption.”
- Comparatives and Superlatives: “Cooling consumption has increased significantly more than lighting.”
Common Pitfalls to Avoid
- Overgeneralization: Avoid stating trends without specific data points.
- Misinterpretation: Ensure data is interpreted accurately and logically.
- Word Count: Keep within 150-200 words for Task 1.
Conclusion
Answering questions related to “Average Household Energy Consumption” in IELTS Writing Task 1 effectively requires keen observation and analysis of specific data trends. By employing precise vocabulary, appropriate grammar, and thorough comprehension, candidates can effectively report and compare relevant features of the given information, aiming for a Band 7+ score.