Understanding energy efficiency ratings is critical in evaluating how households have evolved in terms of energy consumption from 2000 to 2023. This topic not only appears frequently in academic discussions but is also a relevant subject in the IELTS Writing Task 1. In this article, we will explore the topic in depth, providing you with a detailed analysis, sample question, and an exemplified response to guide you through writing a high-scoring IELTS essay.
Sample Task 1 Question
You should spend about 20 minutes on this task.
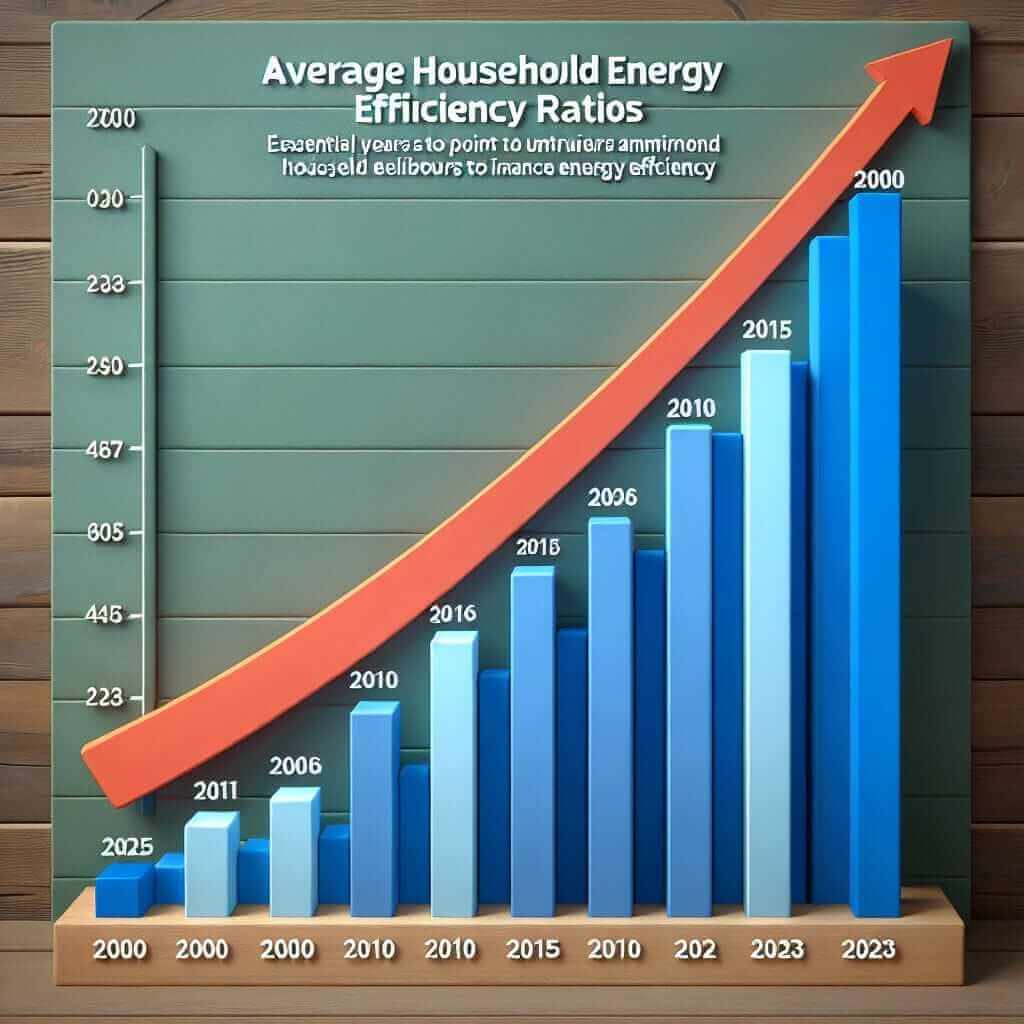
- The chart below shows the average household energy efficiency ratings from 2000 to 2023.
- Summarize the information by selecting and reporting the main features, and make comparisons where relevant.
Write at least 150 words.
Average Household Energy Efficiency Ratings (2000-2023)
Analyzing the Graph/Data
Before diving into the writing process, it is essential to comprehend the data presented. In this case, we will create a hypothetical bar chart which shows the average household energy efficiency ratings over a span of 23 years, from 2000 to 2023.

Key Points to Note:
- The chart depicts fluctuations in energy efficiency ratings over the given period.
- Trends such as increases or decreases over specific years must be highlighted.
- Making relevant comparisons between different years is necessary to exhibit a thorough understanding.
Writing the Introduction
Begin your essay by paraphrasing the question statement. Provide a brief overview of what the chart represents.
Example:
The bar chart illustrates the average energy efficiency ratings for households from the year 2000 to 2023.
Key Trends and Main Features
- Overall Trend:
- There is a noticeable upward trend in energy efficiency ratings over the 23-year period, indicating an increase in household efforts to improve energy efficiency.
- Significant Changes:
- Identify years with significant increases or decreases.
Example:
In 2000, the average energy efficiency rating was at its lowest point of the period, with a gradual increase until 2010 where it saw a dramatic rise.
- Comparisons:
- Compare the highest and lowest points, significant changes, and potential correlations.
Example:
The most considerable improvement was observed between 2010 and 2015, where the rating surged from 60% to 80%.
Vocabulary and Language
When writing an academic essay, a varied vocabulary and correct use of grammatical structures are crucial. Below is a list of useful vocabulary and phrases:
- Vocabulary:
- Fluctuation (n): /ˌflʌk·tʃuˈeɪ·ʃən/
- Surge (v/n): /sɜːdʒ/
- Dramatically (adv): /drəˈmæt·ɪ·kli/
- Notable (adj): /ˈnəʊ·tə·bəl/
- Consistent (adj): /kənˈsɪs·tənt/
- Phrases:
- “An upward/downward trend…”
- “The chart illustrates/depicts…”
- “There was a significant increase/decrease in…”
Sample Answer
The bar chart illustrates the average household energy efficiency ratings from the year 2000 to 2023. Overall, the data depicts an upward trend in energy efficiency ratings, highlighting substantial improvements over the 23-year period.
In 2000, the average rating was approximately 40%, marking the lowest point in the entire period. A gradual increase is observed from 2000 to 2010, where the ratings reached 55%. However, the most dramatic surge occurred between 2010 and 2015, with the ratings climbing from 60% to 80%, demonstrating households’ efforts to adopt more energy-efficient technologies and practices.
After 2015, the ratings remained relatively stable, fluctuating slightly between 78% and 82% until 2020. The years following 2020 saw another upward trend, peaking at 85% in 2023. The data clearly underscores a consistent and notable improvement in household energy efficiency over the specified period.
Word Count: 159
Tips for Writing High-Scoring Essays
- Understand the Data: Take a few minutes to analyze the chart thoroughly before you start writing.
- Paraphrase the Question: Show your command of English by paraphrasing the question effectively.
- Highlight Key Trends: Focus on major trends and significant changes.
- Use Comparisons: Use comparative structures to discuss noticeable differences and similarities.
- Maintain Clear Structure: Organize your essay into clear paragraphs: introduction, main body, and conclusion.
Key Vocabulary to Remember
- Fluctuation (n): a variation or change over time
- Surge (v/n): a sudden and great increase
- Dramatically (adv): in a way that is very sudden or noticeable
- Notable (adj): worthy of attention or notice
- Consistent (adj): acting or done in the same way over time
Conclusion
Writing a high-scoring IELTS Task 1 essay involves understanding the data, identifying key trends, and conveying them using precise vocabulary and structured paragraphs. By following the guidelines and sample provided, you will be well on your way to achieving a Band 7 or higher. Remember, practice is crucial, so keep analyzing different types of charts and practicing your writing skills. Good luck!