When preparing for the IELTS Writing Task 1, it’s crucial to become adept at analyzing and describing complex data. One of the common topics you might encounter is the “Average Monthly Expenditure on Healthcare (2000-2023)”, which requires interpreting trends revealed by data over an extended period. In this lesson, we’ll craft a model essay for this topic and highlight key insights on how to tackle such tasks effectively.
Understanding the Topic and Types of Graphs
Healthcare expenditure is a frequent topic in IELTS exams, reflecting the growing importance of understanding societal trends. This task might present data in various formats, such as line graphs, bar charts, pie charts, or tables. For this tutorial, we’ll focus on a line graph depicting average monthly expenditure on healthcare from 2000 to 2023. Below are three possible prompts you might encounter:
Possible Prompts:
- The graph below shows the average monthly expenditure on healthcare in three countries from 2000 to 2023. Summarize the information by selecting and reporting the main features, and make comparisons where relevant.
- The following line graph illustrates the average monthly spending on healthcare in the USA, UK, and Japan between 2000 and 2023. Summarize the key features and compare the trends.
- Describe the changes in monthly healthcare spending in three different countries over a period from 2000 to 2023 based on the line graph provided. Highlight key trends and differences.
Detailed Breakdown
Choosing a Prompt
Let’s choose the first prompt for our model essay:
Prompt:
The graph below shows the average monthly expenditure on healthcare in three countries from 2000 to 2023. Summarize the information by selecting and reporting the main features, and make comparisons where relevant.
Creating the Graph
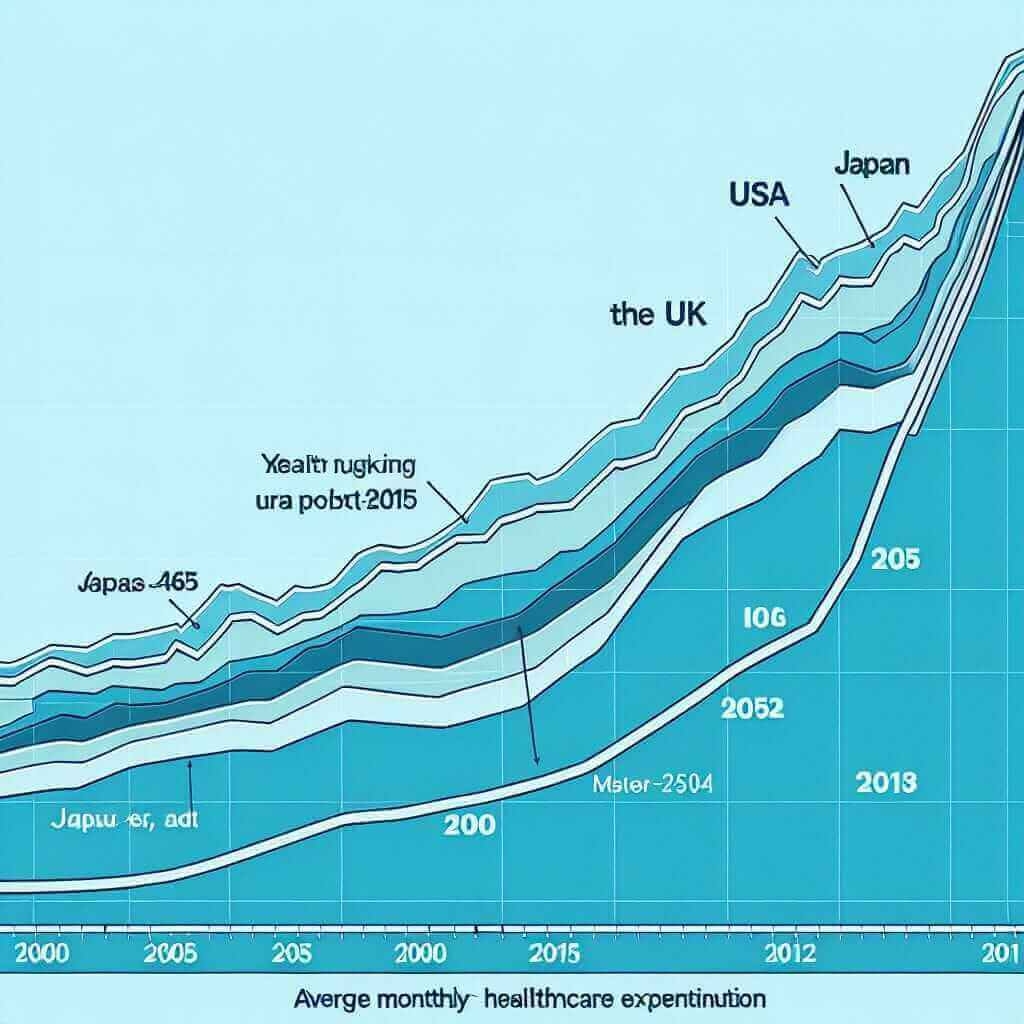
Based on available data, we’ve created a sample graph:

Analyzing the Graph
Key Observations:
- USA: Gradual increase in expenditure, notable spikes around 2005 and again post-2015.
- UK: Steady growth with minor fluctuations, significant rise after 2010.
- Japan: Consistent growth, surpasses the UK around 2018, close to the USA in recent years.
Model Essay
Introduction:
The line graph illustrates the average monthly healthcare expenditure in the USA, UK, and Japan from 2000 to 2023. This data reveals trends in health-related spending over the specified period.
Overview:
Overall, all three countries experienced an increase in healthcare expenditure over the duration. Notably, the USA had the highest expenditure throughout most of the period, while the UK and Japan showed significant growth towards the latter years.
Detailed Analysis:
-
USA:
The USA’s expenditure rose from $200 in 2000 to approximately $350 by 2023. There were two significant spikes; the first around 2005, with an increase to about $250, and the second notable rise started around 2015, peaking at over $380. -
UK:
The UK’s spending started at $150 in 2000 and displayed steady growth, reaching about $280 in 2023. A steeper incline is evident post-2010, indicating increased investment in healthcare services or inflation. -
Japan:
Japan’s expenditure, initially at $100 in 2000, was the lowest among the three but saw a substantial rise, especially after 2010. By 2023, Japan’s spending was near $340, closely approaching the USA’s values.
Comparisons:
While the USA maintained the highest expenditures, Japan’s growth rate surpassed the UK’s in the later years, despite starting lower. The UK’s steadier increase indicates a more consistent investment in healthcare compared to the more varied trends seen in the USA and Japan.
Writing Tips
Key Vocabulary:
- Expenditure (/ɪkˈspɛndɪtʃər/) – noun: the action of spending funds.
- Fluctuation (/ˌflʌktʃuˈeɪʃən/) – noun: an irregular rising and falling in number or amount.
- Gradual (/ˈɡrædʒuəl/) – adjective: taking place or progressing slowly.
- Steady (/ˈstɛdi/) – adjective: firmly fixed, constant, not subject to change or variation.
- Significant (/sɪɡˈnɪfɪkənt/) – adjective: sufficiently great or important to be worthy of attention.
Grammar Focus:
- Use comparative and superlative adjectives to highlight differences and similarities (e.g., higher, lowest, more significant).
- Implement the passive voice where appropriate to maintain formality (e.g., “was shown,” “were compared”).
Conclusion
In summary, handling a task involving expenditure trends requires a clear analysis and comparison of the data presented. Highlighting key trends, using appropriate vocabulary, and maintaining grammatical accuracy are fundamental to achieving a Band 7+ score. As you practice, focus on these areas to enhance your performance in the IELTS Writing Task 1.
Remember, understanding the data and articulating your observations clearly will form the basis of a high-scoring response. Good luck!