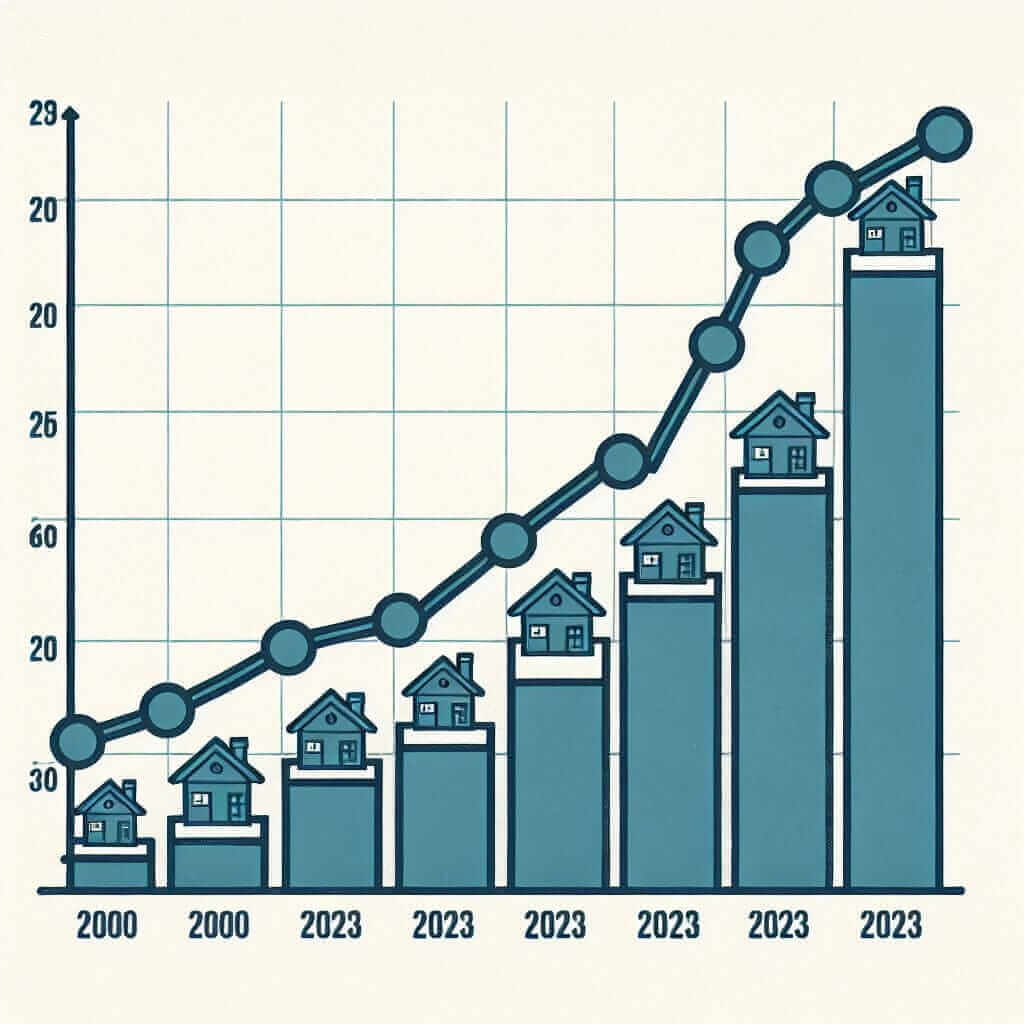
In the IELTS Writing Task 1, candidates are often presented with visual information in the form of graphs, tables, charts, or diagrams. A thematic analysis of these visuals frequently highlights trends and changes over time, similar to Average Monthly Expenditure on Housing and Utilities from 2000 to 2023. These themes align with common IELTS writing tasks, making it essential for aspirants to be well-versed in analyzing such data.
Sample Task Topics:
- The line graph below shows the average monthly expenditure on housing and utilities in Country X from 2000 to 2023. Summarize the information by selecting and reporting the main features and make comparisons where relevant.
- The table illustrates the average monthly costs spent on housing and utilities in various regions during the period from 2000 to 2023. Summarize the information by selecting and reporting the main features and make comparisons where relevant.
- The bar chart presents the average monthly expenditure on housing and utilities in urban and rural areas from 2000 to 2023. Summarize the information by selecting and reporting the main features and make comparisons where relevant.
Let’s select the first task for a detailed analysis and writing sample.
Examining the Sample Task
Task:
The line graph below shows the average monthly expenditure on housing and utilities in Country X from 2000 to 2023.
Data Illustration:
For our analysis, we can create a simulated data set that reveals trends and patterns over the given time period.
| Year | Expenditure ($) |
|---|---|
| 2000 | 500 |
| 2001 | 520 |
| 2002 | 530 |
| 2003 | 550 |
| 2004 | 570 |
| 2005 | 590 |
| 2006 | 610 |
| 2007 | 630 |
| 2008 | 650 |
| 2009 | 670 |
| 2010 | 690 |
| 2011 | 710 |
| 2012 | 730 |
| 2013 | 750 |
| 2014 | 770 |
| 2015 | 780 |
| 2016 | 800 |
| 2017 | 820 |
| 2018 | 840 |
| 2019 | 860 |
| 2020 | 880 |
| 2021 | 900 |
| 2022 | 920 |
| 2023 | 940 |

Analysis of the Task
The line graph data demonstrates a consistent upward trend in the average monthly expenditure on housing and utilities in Country X from 2000 to 2023. There are key points and comparisons to be observed and articulated for a coherent analysis.
Writing Sample
Writing the Report
The line graph elucidates the average monthly expenditure on housing and utilities in Country X over a span of 23 years, from 2000 to 2023. Overall, the graph portrays a steady increase in costs throughout the period.
In 2000, the average expenditure was $500. This figure saw a gradual rise each subsequent year, reaching $570 by 2004 and $630 by 2007. The growth persisted with minor annual increments, and by 2010, expenses had climbed to $690.
The pattern of escalation became more pronounced from 2011 onwards, with the expenditure crossing the $700 mark, reaching $800 in 2016, and attaining $860 in 2019. This upward trend did not abate, as by 2022, the monthly costs had surged to $920.
Finally, in 2023, the expenditure peaked at $940, indicating a typical incline in the cost of housing and utilities. The data underscores an uninterrupted upward trajectory over the 23 years, reflecting factors such as inflation, increased utility costs, and potentially greater housing demands.
(Word count: 162)
Important Considerations for Writing:
Vocabulary and Grammar Notes
Key Vocabulary:
- Elucidates (verb): To make something clear; to describe or explain in detail.
- Increment (noun): An increase or addition, especially one of a series on a fixed scale.
- Escalation (noun): A rapid increase; a rise.
- Trajectory (noun): The path followed by a projectile flying or an object moving under the action of given forces.
Grammar Structures:
- Present Simple Tense: Used to describe the general trend and permanent actions.
- “The graph portrays a steady increase in costs throughout the period.”
- Past Simple Tense: Used for specific data points in the past.
- “In 2000, the average expenditure was $500.”
- Comparatives and Superlatives: Essential for making comparisons.
- “The pattern of escalation became more pronounced from 2011 onwards.”
Conclusion
In conclusion, to achieve a Band 7 or higher in the IELTS Writing Task 1, it is crucial to accurately describe trends, use a wide range of vocabulary, and demonstrate clear grammatical structures. Understanding key aspects such as steady trends and data comparison is paramount. Analyzing data related to average monthly expenditure on housing and utilities from 2000 to 2023 provides a relevant and practical exercise for mastering these skills.