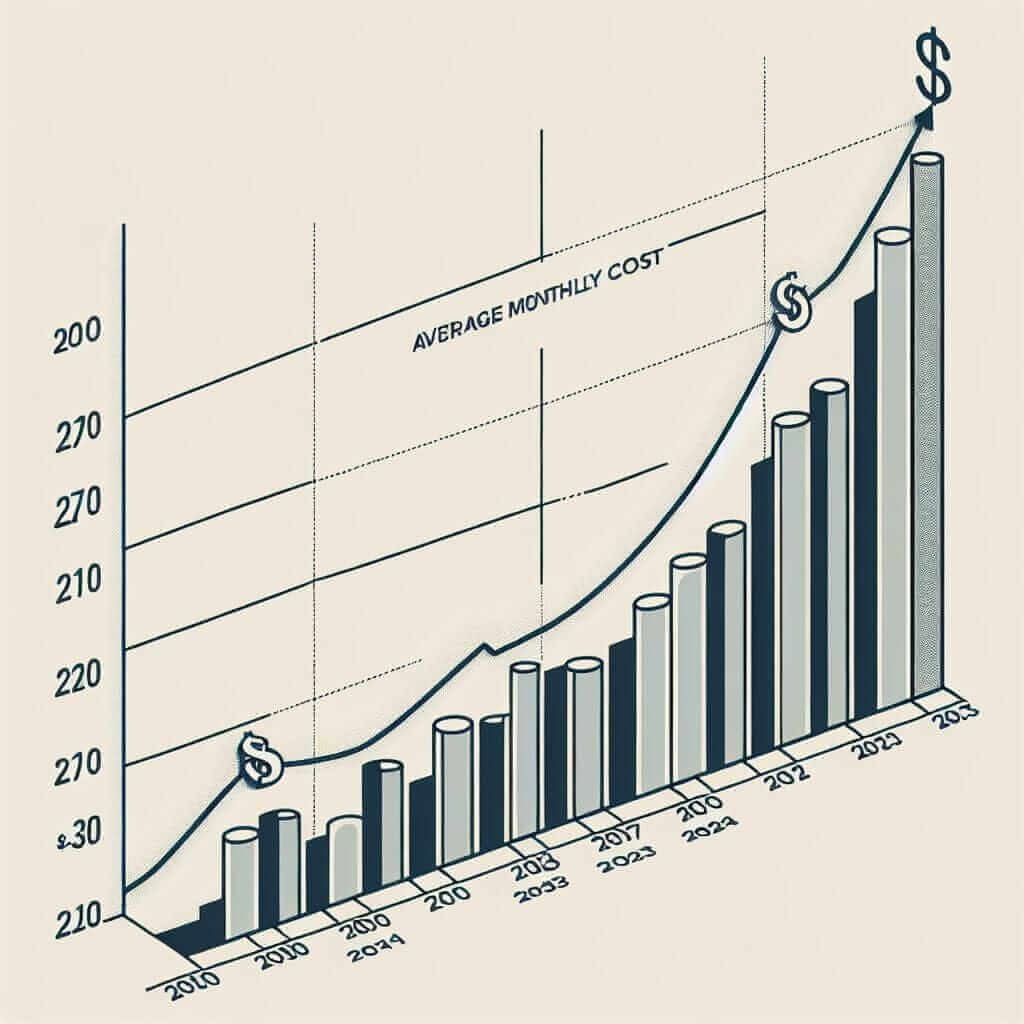
In the IELTS Writing Task 1, candidates are often asked to interpret various kinds of graphical data. One common topic is the analysis of financial data, such as household utility costs over time. This essay will delve into the “Average Monthly Household Utility Costs (2000-2023)” as a sample topic, offering detailed insights into mastering such tasks.
Understanding the Task
The main objective of this task is to describe major trends, compare data, and summarize the information presented in the visual. Students must identify key points and patterns, mention specific data where relevant, and avoid personal opinions.
Sample Task
You should spend about 20 minutes on this task.
The graph below shows the average monthly household utility costs in dollars in a particular country from 2000 to 2023.

Summarize the information by selecting and reporting the main features, and make comparisons where relevant.
Write at least 150 words.
Analyzing the Graph
Key Trends and Observations
-
Trend Identification:
- Identify overall upward or downward trends.
- Note peaks and troughs.
- Mention any periods of stability or fluctuations.
-
Segments:
- Divide the timeframe into segments that display distinct trends or patterns.
- Make comparisons between these segments.
Structure of the Essay
-
Introduction:
- Paraphrase the task prompt.
- Mention what the graph illustrates.
-
Overview:
- Highlight the main trends or notable changes without detailing numerical data.
-
Detailed Comparisons:
- Offer specific data points and compare them across different years.
- Discuss any anomalies or outliers.
Writing Sample
Here’s a band 8 sample answer for the given task:
The graph illustrates the average monthly household utility costs from 2000 to 2023 in a particular country. Overall, there has been a noticeable upward trend in utility expenses over this period, with some fluctuations.
In the initial years from 2000 to 2005, utility costs remained relatively stable, hovering around $100 per month. Following this, there was a significant increase, and by 2010, the average monthly cost had risen to approximately $150. Between 2010 and 2015, the expenses surged sharply, reaching around $220 due to inflation and higher energy prices.
From 2016 to 2018, the costs showed a slight decline, dropping to about $210 per month, perhaps due to regulatory changes or improved energy efficiency. However, this downward trend was short-lived as the prices escalated again, peaking at $280 in 2021. After a brief dip in 2022, the costs stabilized at around $270 in 2023.
In summary, despite some minor fluctuations, the overall trend indicates that household utility costs have increased substantially from 2000 to 2023, reflecting broader economic factors such as inflation and energy pricing.
(180 words)
Tips for Writing a High-Scoring Task
Vocabulary and Grammar
-
Vocabulary:
- Fluctuate (verb) /ˈflʌktʃueɪt/: to rise and fall irregularly.
- Surge (noun) /sɜːrdʒ/: a sudden increase or burst.
- Plummet (verb) /ˈplʌmɪt/: to fall or drop suddenly.
- Stabilize (verb) /ˈsteɪbəlaɪz/: to maintain at a level.
- Anomaly (noun) /əˈnɒməli/: something that deviates from the norm.
-
Grammar:
- Use the present perfect to describe trends continuing up to the present (e.g., “has increased”).
- Use comparatives and superlatives to compare data points (e.g., “higher than,” “the highest”).
- Employ complex sentences to show relationships between data (e.g., “As the prices escalated, the costs peaked…”).
Structured Approach
- Introduction: Keep it concise and clear.
- Overview: Focus on the big picture.
- Body Paragraphs: Provide details systematically, ensuring each paragraph covers a different time segment or data trend.
Conclusion
To excel in IELTS Writing Task 1, especially with topics like “Average Monthly Household Utility Costs (2000-2023),” students must develop a clear understanding of the task requirements. Practicing different types of graphs and focusing on vocabulary and grammar can significantly improve performance, allowing students to achieve a Band 7 or higher. Regular practice, combined with a strategic approach to identifying trends and making comparisons, will lead to excellent results.