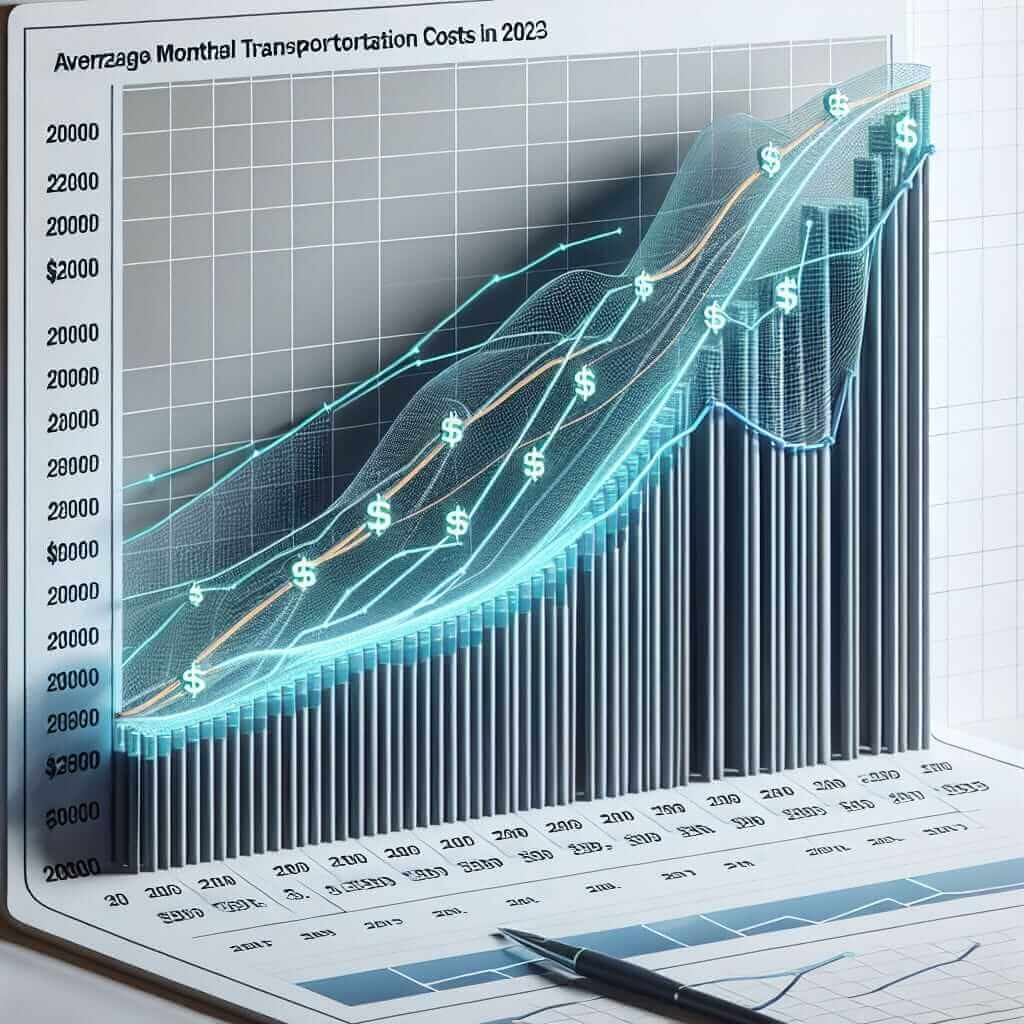
In the IELTS Writing Task 1, data interpretation and presentation are crucial skills. One common type of question presents a graph, chart, or table with data over time. Today, we’ll focus on “Average Monthly Transportation Costs (2000-2023)” — a subject frequently explored to test candidates’ ability to describe trends.
Understanding the Topic: Average Monthly Transportation Costs (2000-2023)
The topic requires analyzing how transportation costs have changed over a specific period. This type of question helps assess a candidate’s ability to interpret data, identify main features, and summarize the text effectively.
Common queries related to this topic include:
- “How have average transportation costs changed from 2000 to 2023?”
- “What are the trends in transportation costs over the years?”
- “Factors influencing changes in transportation costs over two decades.”
Creating a Sample Task
Let’s create a realistic task for practice.
Task:
The line graph below shows the average monthly transportation costs in dollars from 2000 to 2023. Summarize the information by selecting and reporting the main features and make comparisons where relevant.

Analyzing the Task
First, let’s break down the task:
- Identify the overall trend
- Note key data points (peaks, troughs, etc.)
- Compare different periods and highlight significant changes
- Employ specific data to support observations
Writing a Sample Response
Sample Response:
The line graph illustrates the average monthly transportation costs in the United States from 2000 to 2023.
Overall, transportation costs exhibited a significant upward trend over the period despite some fluctuations. In 2000, the transportation costs started at $200 per month. There was a steady rise over the first decade, reaching approximately $350 by 2010.
From 2010 onwards, transportation costs continued to climb but at a faster rate, peaking at $450 in 2015. Following this, the cost plateaued for a few years until slight declines were observed between 2016 and 2018 when it dipped to $430. However, post-2018, there was a sharp increase, with costs hitting an all-time high of $600 by 2023.
Distinct patterns can be noted within the period. The early 2000s experienced moderate increases, whereas the latter half showed more rapid changes, reflecting possibly increased fuel prices or advances in technology making public and private transport more expensive.
Word Count: 159
Key Points to Remember While Writing
-
Structure:
- Introduction: Paraphrase the task question.
- Overview: Summarize the main trends and patterns briefly.
- Details: Provide specific data points, make comparisons, and discuss trends.
-
Vocabulary and Grammar:
- Use varied sentence structures (simple, compound, complex).
- Employ specific vocabulary related to statistics and trends (e.g., “fluctuate,” “increase,” “peak,” “stable”).
Sample Vocabulary:
- Steady (adj) /ˈstɛdi/: constant, continuous
- Fluctuation (n) /ˌflʌktʃuˈeɪʃən/: rise and fall, variation
- Plateau (v) /plæˈtoʊ/: level off, stabilize
- Moderate (adj) /ˈmɒdərɪt/: average, not excessive
- Peak (v) /pik/: reach the highest point
- Grammar Points:
- Use of time-related phrases (“over the period,” “from 2000 to 2023”).
- Comparatives and superlatives (e.g., “higher than,” “the highest”).
- Passive voice for emphasizing actions rather than people (e.g., “costs were observed”).
Vocabulary and Phrases to Note
Here are some key terms related to this topic:
- Average (adj) /ˈævərɪdʒ/ – An equal distribution over a set period.
- Trend (n) /trɛnd/ – The general direction in which something is developing or changing.
- Significant (adj) /sɪɡˈnɪfɪkənt/ – Noteworthy, of considerable importance.
- Period (n) /ˈpɪəriəd/ – A length of time.
- Data points (n) /ˈdeɪtə pɔɪnts/ – Specific values or measurements within the data set.
- Comparison (n) /kəmˈpærɪsən/ – The act of comparing.
- Decline (n) /dɪˈklaɪn/ – A decrease or downward trend.
Conclusion
To achieve a high band score in IELTS Writing Task 1, it’s essential to thoroughly understand the task, select pertinent data points, and describe trends using varied sentence structures and precise vocabulary. Consistent practice with different types of graphs and charts will enhance your ability to interpret and present data effectively, aiming for Band 7+.