The IELTS Writing Task 1 often presents candidates with data in the form of charts, tables, or graphs, requiring them to analyze and summarize the information in a clear and concise manner. A common theme within these tasks is comparing and contrasting trends in economic indicators across different countries. This article focuses on the topic of “Comparing Australia and New Zealand Unemployment Rates (2000-2023)”, a theme that has appeared in past IELTS exams and is relevant to the test’s focus on global socio-economic trends.
Here are some potential IELTS Writing Task 1 questions based on this theme:
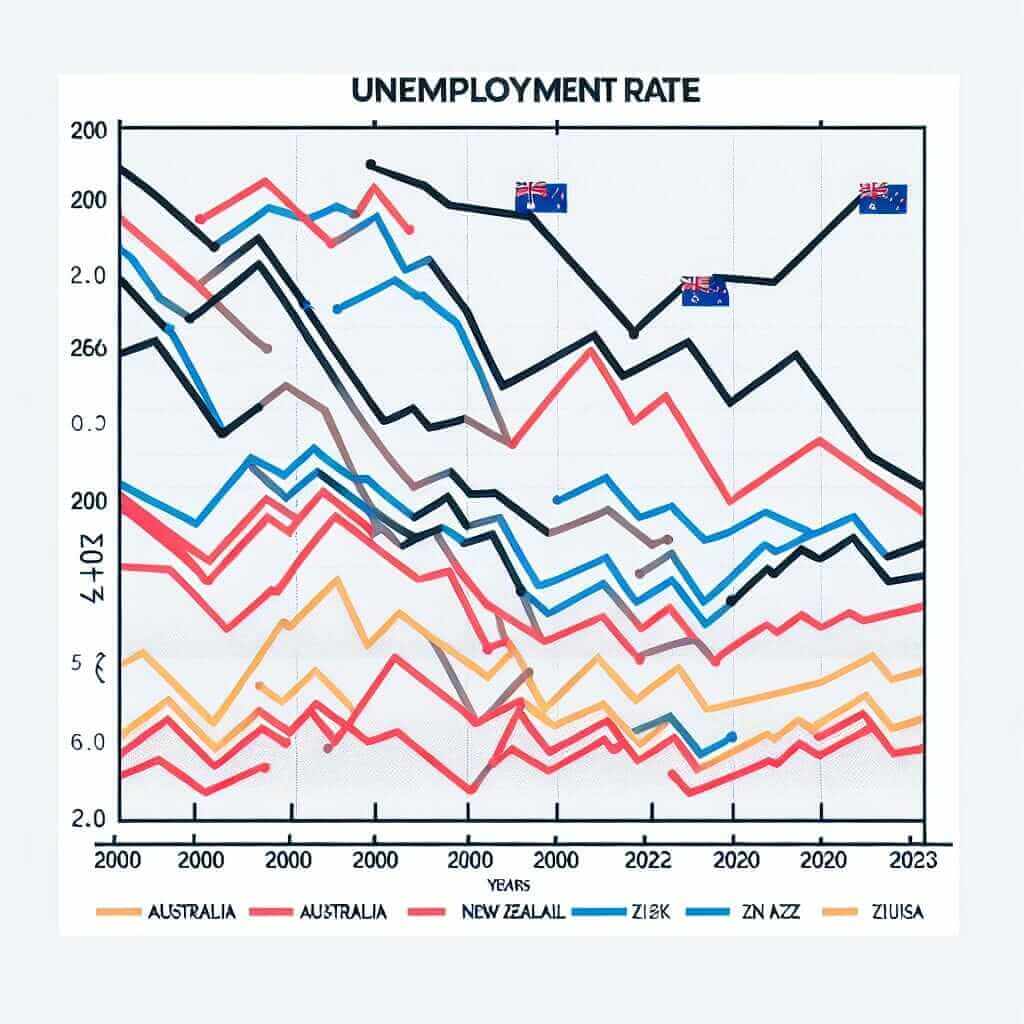
- The line graph below shows the unemployment rates in Australia and New Zealand between 2000 and 2023. Summarize the information by selecting and reporting the main features and making comparisons where relevant.
- The table below provides data on the unemployment rates of Australia and New Zealand for selected years from 2000 to 2020. Write a report for a university lecturer describing the information shown.
- The chart illustrates the percentage of unemployed individuals in Australia and New Zealand across different age groups in 2023. Summarize the information by selecting and reporting the main features and make comparisons where relevant.
Sample IELTS Writing Task 1 Question and Model Answer
1. The line graph below shows the unemployment rates in Australia and New Zealand between 2000 and 2023. Summarize the information by selecting and reporting the main features and making comparisons where relevant.

Analysis of the Task
This task presents a line graph and asks for a description of the main trends in unemployment rates in Australia and New Zealand. Key points to remember when answering:
- Overview: Begin with an introductory sentence summarizing the main trend.
- Key Features: Identify significant changes, peaks, troughs, and periods of stability in the data for both countries.
- Comparisons: Highlight any similarities or differences in the unemployment rate trends between Australia and New Zealand.
- Data: Support your statements with specific data points from the graph.
- Concision: Be clear and concise in your language, aiming for a report length of at least 150 words.
Model Answer
The line graph illustrates the fluctuations in unemployment rates in Australia and New Zealand over a 23-year period, from 2000 to 2023. Overall, both countries experienced periods of both rising and falling unemployment, with New Zealand generally exhibiting higher rates than Australia.
At the start of the millennium, Australia’s unemployment rate stood at 6.5%, while New Zealand recorded a slightly higher rate of 5.8%. In the following years, Australia’s rate gradually declined, reaching its lowest point of 4% in 2008. Conversely, New Zealand’s unemployment rate fluctuated, peaking at 7% in 2002 before declining to 4.5% in 2007.
The global financial crisis of 2008 had a noticeable impact on both countries. Australia’s unemployment rate jumped to 6% in 2009, while New Zealand’s surged to 6.5%. In the ensuing years, both countries saw their unemployment rates gradually decrease. However, from 2015 onwards, Australia consistently maintained lower unemployment figures compared to New Zealand. By 2023, Australia reported an unemployment rate of approximately 5%, whereas New Zealand recorded a rate of 5.5%.
(Word count: 176)
Key Writing Tips for IELTS Task 1
- Paraphrasing: Rephrase the question prompt in your introduction to demonstrate vocabulary range. For instance, instead of repeating “shows,” use “illustrates” or “depicts.”
- Data Selection: Don’t try to describe every single data point. Focus on the most significant trends and use data to support your observations.
- Tense Usage: Use the past tense when describing past trends and the present tense for information that is still current (e.g., the final year on the graph).
- Vocabulary for Describing Trends: Familiarize yourself with verbs, adverbs, and adjectives used to describe increases (e.g., rise, surge, significantly), decreases (e.g., fall, decline, gradually), and fluctuations (e.g., fluctuate, vary, unstable).
- Linking Words: Use a variety of linking words and phrases (e.g., whereas, however, similarly, in contrast) to connect your ideas and create coherence in your writing.
Useful Vocabulary
- Fluctuations: (Noun) /ˌflʌk.tʃuˈeɪ.ʃənz/ – irregular rising and falling in number or amount.
- Conversely: (Adverb) /ˈkɒn.vɜːs.li/ – in an opposite way.
- Surge: (Verb) /sɜːdʒ/ – to increase suddenly and powerfully.
- Gradually: (Adverb) /ˈɡrædʒ.u.ə.li/ – slowly, over a long period.
- Consistently: (Adverb) /kənˈsɪs.tənt.li/ – in a way that does not change.
Conclusion
Mastering the art of describing and comparing data in IELTS Writing Task 1 is crucial for achieving a Band 7 or higher. By following the tips outlined above, familiarizing yourself with common vocabulary, and practicing regularly with authentic sample questions like the one provided, you can significantly improve your ability to analyze and articulate complex data trends effectively. Remember, clarity, accuracy, and appropriate language use are key to success in this section of the IELTS exam.