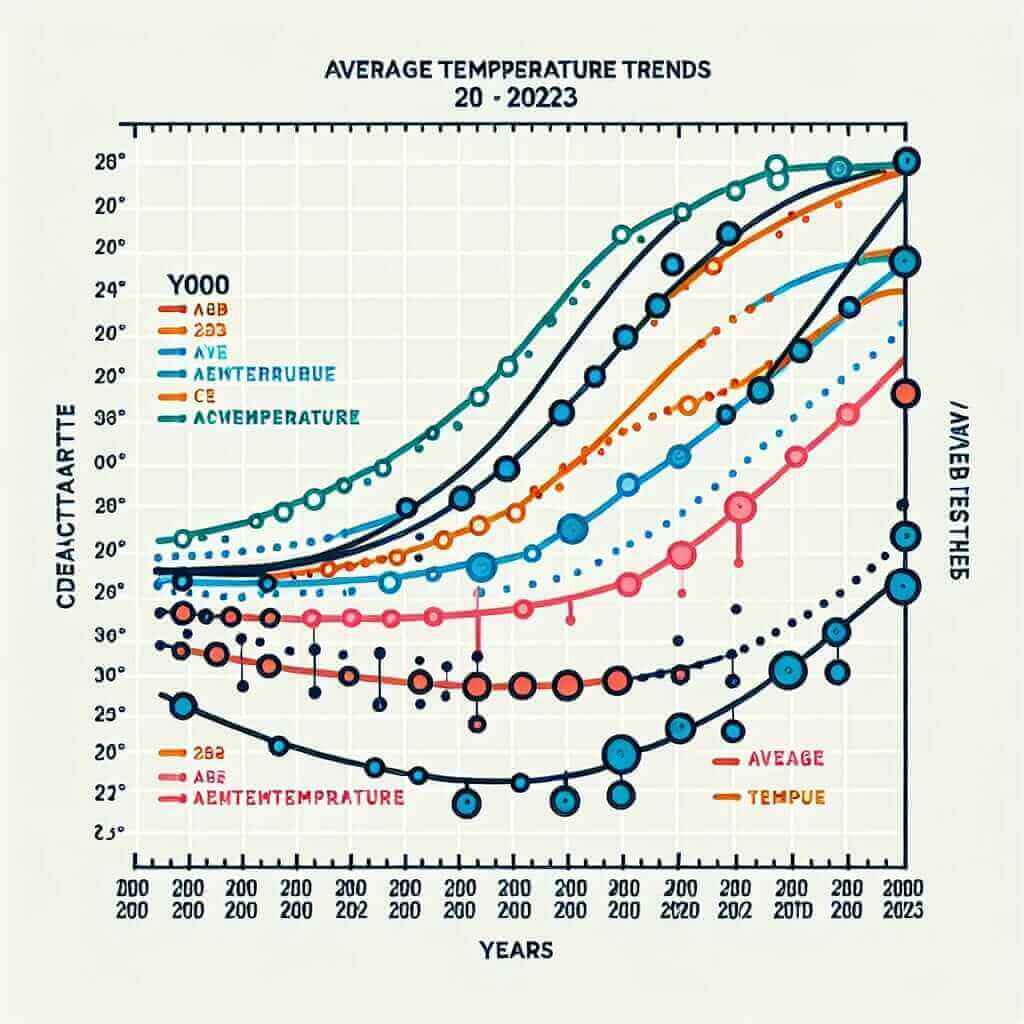
Understanding and interpreting data on average temperatures across different regions over time is a common task in the IELTS Writing Task 1 exam. In this article, we’ll delve into this topic, focusing on how to effectively write about such data. This discussion is especially useful for those preparing for the IELTS exam, aiming for a proficiency level of Band 7 and above.
Introduction
In IELTS Writing Task 1, you are often asked to describe, summarize, or explain information presented in a graph, chart, table, or diagram. “Comparing Average Temperatures in Different Regions (2000-2023)” is a typical topic where candidates need to analyze temperature trends in various regions over a specified period.
Let’s consider a sample prompt to illustrate this topic:
Sample Prompt
You should spend about 20 minutes on this task.
The table below shows the average temperatures of different regions from the year 2000 to 2023. Summarize the information by selecting and reporting the main features and make comparisons where relevant.
Write at least 150 words.
| Year | Region A (°C) | Region B (°C) | Region C (°C) | Region D (°C) |
|---|---|---|---|---|
| 2000 | 20 | 22 | 15 | 18 |
| 2005 | 21 | 23 | 16 | 19 |
| 2010 | 22 | 24 | 17 | 20 |
| 2015 | 23 | 25 | 18 | 21 |
| 2020 | 24 | 26 | 19 | 22 |
| 2023 | 25 | 27 | 20 | 23 |

Analyzing the Prompt
Before diving into writing, it is crucial to analyze the prompt and understand what is being asked. Here, the table provides average temperatures for four regions over six years. Your task is to summarize the data, noting trends and significant changes.
Structure of the Essay
Your essay should have a clear structure:
- Introduction: Paraphrase the question.
- Overview: Summarize the main trends.
- Body Paragraphs: Provide detailed comparisons and data.
Step-by-Step Guide
Introduction
Start by paraphrasing the prompt. This means you need to express the same idea in different words.
Example:
“The table illustrates the average temperatures in four regions from the year 2000 to 2023.”
Overview
Provide a summary of the overall trends. Identify any common patterns, such as rising temperatures across all regions.
Example:
“Overall, it is apparent that the average temperatures in all four regions have climbed steadily over the period.”
Body Paragraphs
Detail the trends with specific data points. Discuss patterns over time and make comparisons between regions.
Example:
“In 2000, Region B had the highest average temperature at 22°C, while Region C was the coolest at 15°C. By 2023, temperatures had risen in all regions, with Region B maintaining the highest temperature of 27°C and Region C reaching 20°C. The data indicates a consistent year-on-year increase across all regions. Region A, which started at 20°C in 2000, increased to 25°C by 2023. Similarly, Region D warmed from 18°C to 23°C in the same period.”
Vocabulary and Grammar Tips
Vocabulary:
- Trend (n.) /trend/: A general direction in which something is developing or changing.
- Fluctuate (v.) /ˈflʌktʃueɪt/: To rise and fall irregularly.
- Increment (n.) /ˈɪŋkrəmənt/: An increase or addition, especially one of a series on a fixed scale.
- Consistently (adv.) /kənˈsɪstəntli/: In every case or on every occasion.
- Significant (adj.) /sɪɡˈnɪfɪkənt/: Sufficiently great or important to be worthy of attention.
Grammar:
- Comparatives and Superlatives: Use these to make comparisons between different regions.
- Example: “Region B experienced a more significant increase compared to Region A.”
- Past and Present Perfect Tenses: Useful for describing changes over time.
- Example: “The temperature in Region D has increased by 5°C since 2000.”
- Passive Voice: Use for variability in sentence structure.
- Example: “The temperatures were recorded annually.”
Sample Essay
“The table illustrates the average temperatures in four regions from the year 2000 to 2023. Overall, it is apparent that the average temperatures in all four regions have climbed steadily over the period.
In 2000, Region B had the highest average temperature at 22°C, while Region C was the coolest at 15°C. By 2023, temperatures had risen in all regions, with Region B maintaining the highest temperature of 27°C and Region C reaching 20°C. The data indicates a consistent year-on-year increase across all regions. Region A, which started at 20°C in 2000, increased to 25°C by 2023. Similarly, Region D warmed from 18°C to 23°C in the same period.
Region B showed the most significant increase, rising by 5°C from 22°C to 27°C. Region A and Region D experienced similar increments of 5°C, moving from 20°C to 25°C and 18°C to 23°C, respectively. Region C, although consistently the coolest, also saw a considerable rise of 5°C.”
Word Count: 163
Conclusion
When approaching the IELTS Writing Task 1, focus on understanding the prompt and structuring your essay clearly. Using appropriate vocabulary and grammar structures can significantly enhance your score. Always remember to paraphrase the question, summarize the trends, and provide detailed comparisons. With consistent practice and careful analysis, you can achieve a high band score in the IELTS writing task.