Birth rates are a significant indicator of demographic trends and can profoundly affect a country’s socio-economic landscape. They are a common topic in the IELTS Writing Task 1, where candidates may be asked to compare and analyze birth rates across different countries over a given period. Understanding how to express and compare these figures effectively is critical for scoring well in this section.
In this article, we will explore:
- The importance of birth rates and how they are portrayed in IELTS Writing Task 1.
- How to approach and analyze a task involving birth rates.
- Vocabulary and grammatical structures essential for this type of task.
- A model answer for a sample task.
We will create an example question based on the theme “Comparing Birth Rates in Various Countries (2000-2023)” and guide you through the process of writing a clear, cohesive, and well-structured response.
Sample Task
You should spend about 20 minutes on this task.
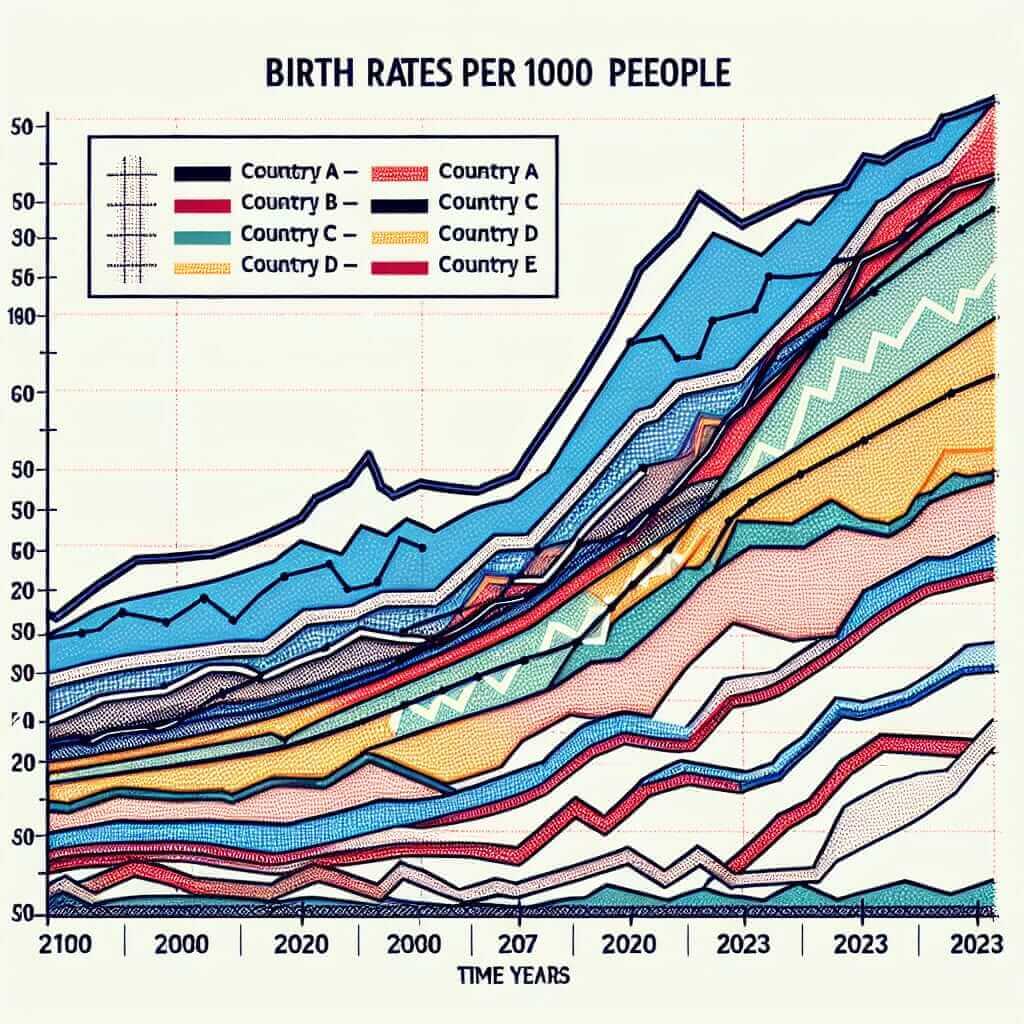
The graph below shows the birth rates in five different countries from 2000 to 2023.

Summarize the information by selecting and reporting the main features, and make comparisons where relevant.
Write at least 150 words.
Analyzing the Task
When you approach this task, consider the following steps:
- Understand the Graph: Look closely at the x-axis (years) and y-axis (birth rates) to identify trends and fluctuations. Note which countries are being compared.
- Identify Key Features: Are there significant increases or decreases? Which country has the highest or lowest birth rates? Are there periods where the birth rates are stable?
- Group Data: If possible, group countries with similar trends to make your writing clearer.
- Plan Your Writing: Structure your response with an introduction, an overview of the main trends, and specific details.
Model Answer
Introduction
The line graph illustrates the birth rates in five different countries, namely Country A, Country B, Country C, Country D, and Country E, from the year 2000 to 2023.
Overview
Overall, the birth rates in these countries have shown varying trends over the given period. While some countries have experienced a steady decline, others have seen fluctuations or gradual increases.
Specific Details
In the year 2000, Country A had the highest birth rate at 25 births per thousand people. However, this figure declined significantly to 15 per thousand by 2023. Similarly, Country B also witnessed a downward trend, decreasing from 20 to 12 births per thousand.
In contrast, Country C and Country D showed a different pattern. Country C’s birth rate increased from 10 per thousand in 2000 to 18 per thousand in 2015 before stabilizing. Country D experienced fluctuations, starting at 15 per thousand, peaking at 22 per thousand in 2010, and falling back to 16 per thousand by 2023.
Country E maintained a relatively stable birth rate throughout the period, lingering around 14 to 16 births per thousand.
Word Count
The above response is approximately 170 words in length.
Tips for Writing
- Use Comparisons: When describing data, make comparisons clear. Phrases like “while,” “whereas,” and “in contrast” are useful for comparing.
- Use Data: Always back up your statements with specific data from the graph.
- Structure Properly: Have a clear introduction, overview, and body paragraphs. The overview should summarize the main trends, and the body paragraphs should provide specific details.
- Avoid Overcomplicating: Keep sentences clear and concise. Use complex sentences where appropriate, but avoid overly complicated structures that could confuse the reader.
Vocabulary to Remember
- Decline: (v.) /dɪˈklaɪn/ – to decrease or reduce in number.
- Fluctuate: (v.) /ˈflʌk.tʃu.eɪt/ – to rise and fall irregularly.
- Peak: (v.) /piːk/ – to reach the highest point.
- Stable: (adj.) /ˈsteɪ.bəl/ – not changing frequently and not likely to become worse.
- Trend: (n.) /trɛnd/ – a general direction in which something is developing or changing.
- Significant: (adj.) /sɪɡˈnɪf.ɪ.kənt/ – sufficiently great or important to be worthy of attention.
Conclusion
To achieve a Band 7+ in IELTS Writing Task 1, it’s crucial to accurately interpret data, use a range of vocabulary and grammatical structures, and present your ideas clearly and logically. Practice with various types of data, including line graphs, bar charts, and tables, to become proficient in identifying key trends and making comparisons. Remember, clarity and coherence are key to success.