Crime rates have always been a significant topic of discussion, especially when comparing urban and rural areas. As IELTS candidates aiming for high scores in Writing Task 1, it’s crucial to grasp how to describe, interpret, and compare data effectively. In this article, we will delve into the crime rates in urban and rural areas from 2000 to 2023, offering insights and model answers for your IELTS preparation.
Common Queries and Keywords Related to Comparing Crime Rates
- Difference in crime rates between urban and rural areas
- Trends in crime rates from 2000 to 2023
- Rural vs. urban crime statistics
- How to describe crime trends in IELTS Writing Task 1
Task 1: Model Answer Based on Crime Rates Data
Example Task:
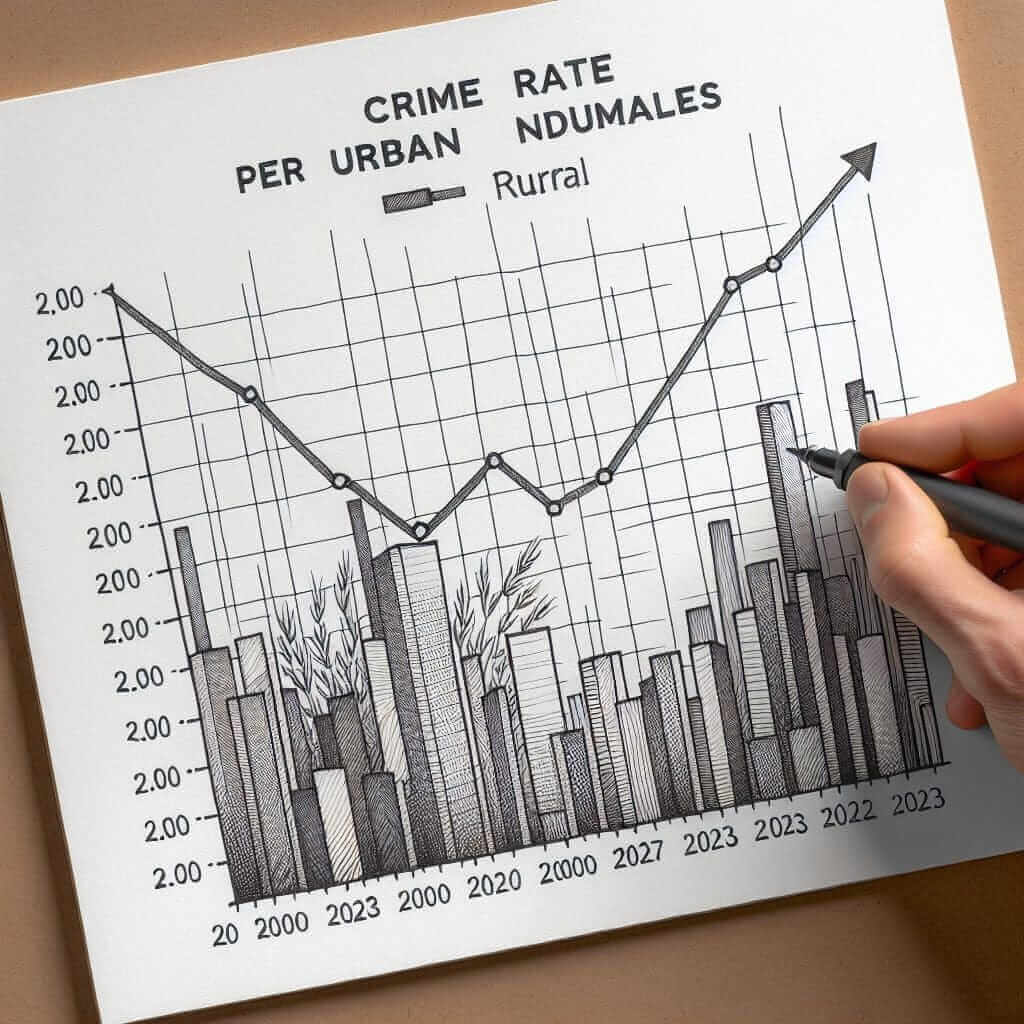
The line graph below shows the crime rates in urban and rural areas from 2000 to 2023. Summarize the information by selecting and reporting the main features, and make comparisons where relevant.
Creating a Hypothetical Line Graph:
Assume we have a line graph displaying the crime rates per 1000 people over the years 2000 to 2023.
- Urban Areas: The crime rate starts at 50 incidents per 1000 people in 2000, peaks at 80 in 2005, then gradually declines to 40 in 2023.
- Rural Areas: The crime rate starts at 30 incidents per 1000 people in 2000, peaks at 45 in 2010, and falls to 25 in 2023.

Analysis of the Task:
When analyzing graphs or charts in IELTS Writing Task 1, it’s essential to:
- Identify the trends.
- Select key features for comparison.
- Use appropriate vocabulary and grammar to describe the data.
Model Answer:
The line graph compares the crime rates in urban and rural areas from 2000 to 2023. Generally, urban areas experienced a higher crime rate compared to rural areas throughout the period.
In 2000, the crime rate in urban areas stood at 50 incidents per 1000 people, which was significantly higher than the 30 incidents per 1000 people recorded in rural areas. The urban crime rate peaked at 80 in 2005, followed by a noticeable decline to 40 by 2023. Conversely, the rural crime rate peaked at 45 in 2010 and then decreased steadily to 25 by 2023.
Overall, while both areas saw fluctuations, urban areas consistently had higher crime rates. However, the gap between urban and rural crime rates narrowed over the years, particularly from 2010 onwards.
Word count: 140
Key Vocabulary and Phrases
- Incidents per 1000 people: A standard measure used in crime statistics.
- Peaked: Reached the highest point.
- Noticeable decline: A significant reduction.
- Conversely: Expressing the opposite trend or pattern.
- Fluctuations: Variations or changes over a period.
Grammar Focus: Comparatives and Superlatives
- Comparatives: “Higher”, “lower” (indicate comparison between urban and rural areas)
- Superlatives: “Highest”, “lowest” (peak points in the time period)
Tips for Writing Task 1:
- Understand the Data: Always take a moment to understand the axes and units of measurement.
- Identify Key Trends: Look for overall trends, peaks, and troughs.
- Use Comparative Language: Effectively compare different data points.
- Keep it Clear and Concise: Your response should be clear and within the word limit (150-180 words).
Conclusion
In IELTS Writing Task 1, handling tasks like comparing crime rates requires a clear understanding of data and proficient use of comparative and descriptive language. By following the tips and analyzing model answers, you can enhance your writing skills and aim for a high band score. Remember to practice regularly and analyze different types of data presentations.