Inflation rates, which indicate the percentage change in the price level of goods and services over a period of time, are an essential economic indicator. Given the global economic shifts over the past two decades, comparing inflation rates in different countries from 2000 to 2023 can be a common topic in the IELTS Writing Task 1. This task typically involves analyzing charts, graphs, or tables. Let’s delve into this topic to enhance your writing skills for the IELTS exam.
Sample Writing Task 1 Prompts
- The line graph below shows the inflation rates in three different countries (USA, Japan, and Brazil) from 2000 to 2023. Summarize the information by selecting and reporting the main features, and make comparisons where relevant.
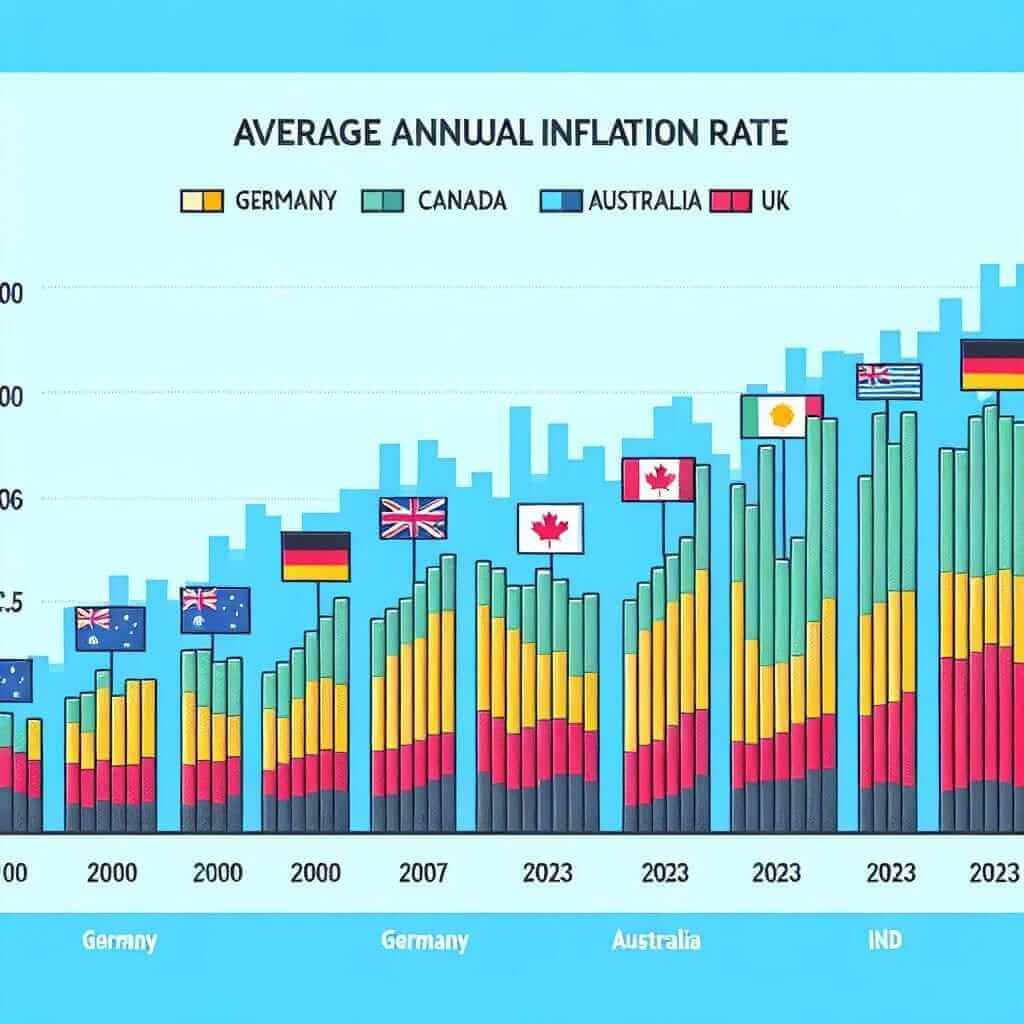
- The bar chart illustrates the average annual inflation rates in five countries (Germany, Canada, Australia, UK, and India) over the period from 2000 to 2023. Summarize the information by selecting and reporting the main features, and make comparisons where relevant.
- The table below compares the inflation rates in four countries (China, Russia, Spain, and France) for the years 2000, 2010, and 2023. Summarize the information by selecting and reporting the main features, and make comparisons where relevant.
Sample Task Selection and Data Creation
Let’s choose the second prompt and create a bar chart for it.
Creating the Chart
Below is the bar chart showing the average annual inflation rates in five countries (Germany, Canada, Australia, UK, and India) from 2000 to 2023.

Analyzing the Task
In this task, you need to:
- Identify the main features and overall trends in the data.
- Compare the inflation rates among the different countries.
- Highlight any significant changes or comparisons.
Writing the Sample Response
Sample Band 7+ Response (174 words):
The bar chart shows the average annual inflation rates in Germany, Canada, Australia, the UK, and India from 2000 to 2023. Overall, India experienced the highest inflation rates throughout the period, whereas Germany had the lowest rates consistently.
India’s inflation rate started at around 4.5% in 2000, peaking at 8% in 2010, and slightly declining to 7% by 2023. In contrast, Germany’s inflation rate remained stable, starting at 1.2%, rising to 2% in 2010, and returning to 1.5% in 2023.
Canada and Australia showed similar patterns, both starting at approximately 2.5% in 2000. Canada’s inflation increased to 3.5% in 2010, then decreased to 2.8% in 2023. Similarly, Australia’s rate reached about 4% in 2010 before dropping to 3% by 2023.
The UK experienced moderate fluctuations, starting at 2% in 2000, spiking to 4.2% in 2010, and stabilizing at 3.5% in 2023.
In summary, despite fluctuations, India consistently recorded higher inflation rates, while Germany maintained the lowest rates over the 23-year period.
Key Points for Writing a High-Scoring Response
Vocabulary and Structure
- Use accurate and varied vocabulary: “stable,” “consistent,” “peak,” “decline,” “fluctuations.”
- Use complex sentences and accurate grammatical structures.
Noteworthy Vocabulary:
- Inflation rate (n) /ɪnˈfleɪ.ʃən reɪt/
- Peak (v) /piːk/
- Decline (v) /dɪˈklaɪn/
- Stable (adj) /ˈsteɪ.bəl/
- Fluctuate (v) /ˈflʌk.tʃu.eɪt/
- Moderate (adj) /ˈmɒd.ər.ət/
- Consistent (adj) /kənˈsɪs.tənt/
- Comparison (n) /kəmˈpær.ɪ.sən/
- Significant (adj) /sɪɡˈnɪf.ɪ.kənt/
- Annual (adj) /ˈæn.ju.əl/
Conclusion
To excel in IELTS Writing Task 1, focus on identifying key trends, making relevant comparisons, and using a range of vocabulary and sentence structures accurately. Practice with different types of data visualizations, and always adhere to the word count requirements to achieve a Band 7 or higher.