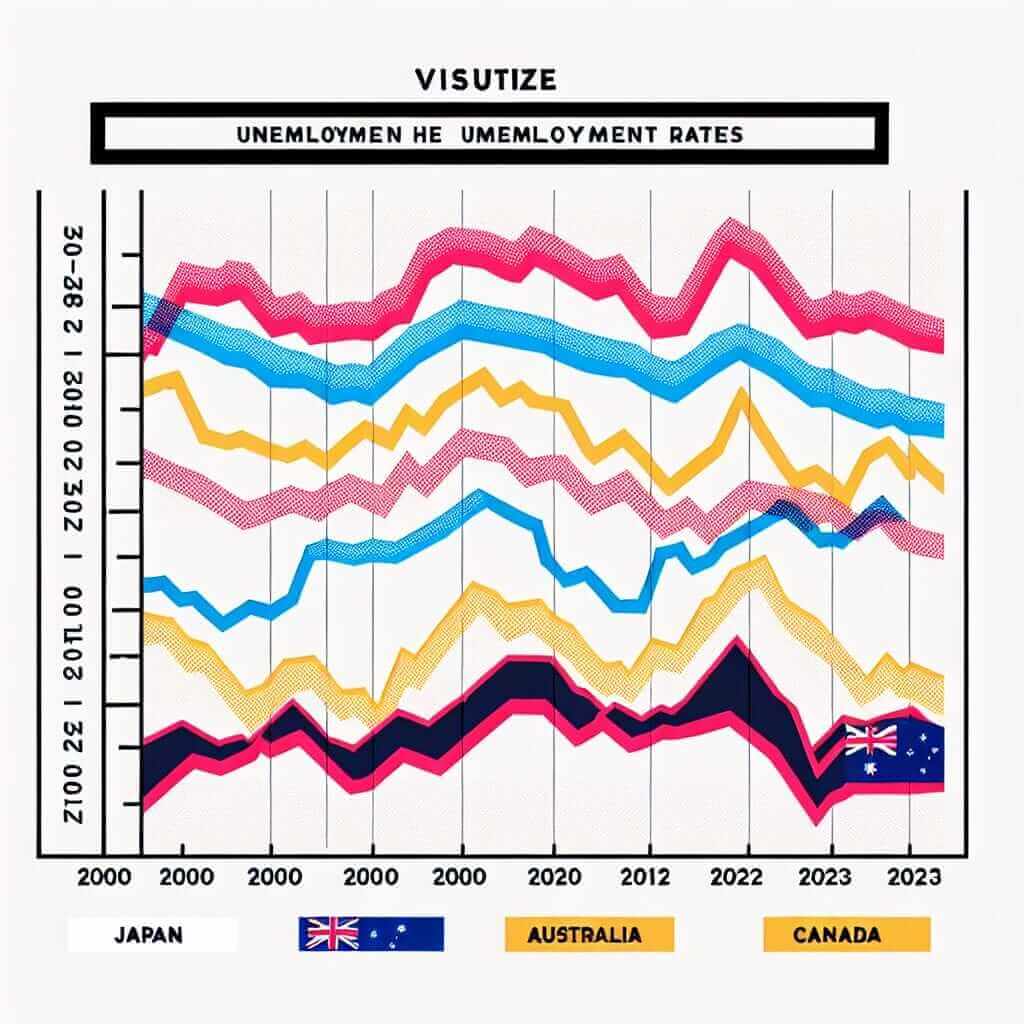
The IELTS Writing Task 1 often presents data in various formats, requiring test-takers to analyze and present information clearly and concisely. One common theme is comparing economic indicators across different countries. This article will focus on the topic of “Comparing Japan, Australia, and Canada Unemployment Rates (2000-2023)”, a subject that frequently appears in IELTS Writing Task 1.
Here are some potential IELTS Writing Task 1 questions related to this theme:
- The line graph below shows the unemployment rates in Japan, Australia, and Canada between 2000 and 2023. Summarize the information by selecting and reporting the main features, and make comparisons where relevant.
- The table illustrates the percentage of unemployed individuals in Japan, Australia, and Canada at five-year intervals from 2000 to 2020. Write a report for a university lecturer describing the information shown below.
- Compare and contrast the unemployment trends in Japan, Australia, and Canada from 2000 to 2023, based on the provided bar chart.
Sample IELTS Writing Task 1 Question and Model Answer
Let’s focus on the first question and develop a model answer based on a hypothetical line graph.
Data Interpretation and Analysis

Analyzing the Task
This task requires you to describe the changes in unemployment rates in three countries over a 23-year period. You need to:
- Identify the overall trends: Are the rates generally increasing, decreasing, or fluctuating?
- Highlight significant changes: Note any sharp rises, falls, or periods of stability.
- Compare and contrast: Identify similarities and differences in the unemployment trends of the three countries.
Model Answer
The line graph illustrates the fluctuations in unemployment rates in Japan, Australia, and Canada between 2000 and 2023.
At the beginning of the period, Japan had the lowest unemployment rate at approximately 4%, while Australia’s rate stood at 6%, and Canada’s was slightly higher at 7%. Over the next five years, Japan experienced a slight increase in unemployment, reaching 5% in 2005, while both Australia and Canada saw their rates decline to 5% and 6% respectively.
From 2005 onwards, the trends diverged. Japan’s unemployment rate fluctuated between 4% and 5% for the following ten years before declining to a low of 2.5% in 2018. Conversely, Australia and Canada experienced more significant fluctuations. Australia’s rate peaked at 8% in 2010 before gradually decreasing to 5% by 2023. Canada followed a similar pattern, reaching its highest point of 9% in 2010 and then steadily falling to 6% by the end of the period.
Overall, while all three countries witnessed fluctuations in their unemployment rates, Japan consistently maintained a lower rate compared to Australia and Canada.
Word count: 175 words
Key Considerations for Writing Task 1
- Paraphrase the question: Avoid copying the question directly; rephrase it in your own words.
- Overview: Provide a general overview of the main trends in the second paragraph.
- Data Selection: Select the most significant data points to support your analysis.
- Comparisons: Clearly compare and contrast the data for different categories.
- Grammar and Vocabulary: Use a variety of grammatical structures and vocabulary related to trends, comparisons, and data interpretation.
- Time Management: Allocate your time effectively to analyze the data and write a well-structured response.
Useful Vocabulary for Describing Trends
- Increase: rise, climb, surge, soar, escalate, go up, grow, increase, shoot up
- Decrease: fall, decline, drop, decrease, dip, plunge, plummet, reduce
- Fluctuate: fluctuate, vary, oscillate, go up and down
- Stability: remain stable, level off, stabilize, remain constant
- Peak: reach a peak, peak at, reach its highest point
- Bottom out: bottom out, reach a low point
Difficult Vocabulary
- Fluctuation (noun): /ˌflʌktʃuˈeɪʃən/ – an irregular rising and falling in number or amount; a variation.
- Diverge (verb): /daɪˈvɜːrdʒ/ – to develop in a different direction.
- Conversely (adverb): /ˈkɒn.vɜːs.li/ – in an opposite way.
- Consistently (adverb): /kənˈsɪs.tənt.li/ – in a way that does not change.
- Steadily (adverb): /ˈsted.əl.i/ – in a gradual, regular way over a period of time.
Conclusion
Mastering IELTS Writing Task 1 requires practice, understanding data interpretation, and using appropriate vocabulary. By analyzing model answers and practicing with sample tasks like the one presented here, you can improve your ability to effectively describe and compare data, ultimately boosting your IELTS score. Remember to focus on clarity, accuracy, and conciseness in your writing.