Analyzing the levels of access to clean water in various countries from 2000 to 2023 is a crucial topic that often appears in IELTS Writing Task 1. Understanding trends, comparisons, and patterns in data presentation is essential for achieving a high band score. In this article, we will explore several aspects of this topic to help you excel in your IELTS writing exam.
Common Exam Prompts
One common type of prompt you might encounter in the IELTS exam could include:
- The line graph below shows the percentage of people who had access to clean water in different countries from 2000 to 2023. Summarize the information by selecting and reporting the main features and make comparisons where relevant.
Let’s break down this task step by step.
Select a Prompt and Create a Sample Essay
Data Presentation
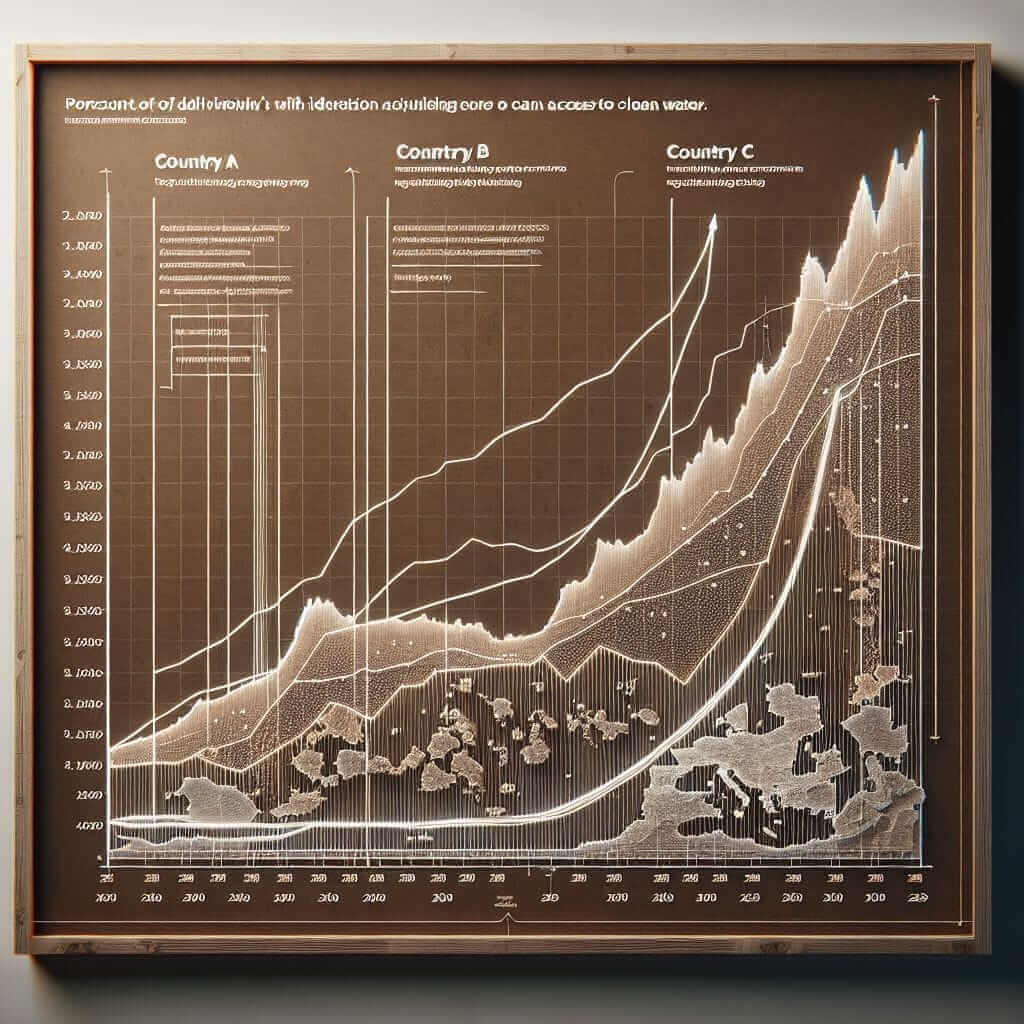
We will create a line graph detailing the access to clean water in three countries: Country A, Country B, and Country C from 2000 to 2023.

Analyzing the Prompt
For our task, we will summarize the key points of the data provided and make appropriate comparisons. Frequently noticed patterns include increases or decreases in access, stability of access levels, and differences between countries.
Sample Essay
The line graph illustrates the percentage of people who had access to clean water across three countries, namely Country A, Country B, and Country C, from 2000 to 2023.
Overall, the percentage of the population with access to clean water increased in all three countries over the given period. However, the rate of increase and the levels of access varied significantly between the countries.
In 2000, Country A had the highest level of access at approximately 73%, while Country B and Country C had much lower levels at around 41% and 30%, respectively. Over the years, Country A experienced a consistent increase, reaching around 95% by 2023. This steady upward trend signifies a significant improvement in clean water access.
On the other hand, Country B and Country C showed more dramatic changes. Country B saw a substantial rise between 2000 and 2015, peaking at 80%, after which the increase tapered off, stabilizing at around 85% by 2023. Conversely, Country C had a slower start, with moderate improvements until 2010, after which the percentage surged, finishing at 70% in 2023.
In conclusion, although all three countries improved their access to clean water over the 23-year period, Country A consistently had the highest levels, Country B made rapid advancements but stabilized, and Country C, despite a slow start, made significant gains towards the latter half of the period.
Word Count: 225
Useful Tips for Writing
- Structure: Always structure your essay clearly with an introduction, body paragraphs, and a conclusion.
- Overview: Provide a general overview of the main trends or differences shown in the data.
- Details: Use specific data points to support your observations and comparisons.
- Language: Use comparative language (e.g., higher than, lower than, improving, decreasing) and time phrases accurately (e.g., over the years, by 2023, initially).
Essential Vocabulary and Grammar
Vocabulary
- Steady (adj.) /ˈstedi/: constant, not changing
- Significant (adj.) /sɪɡˈnɪfɪkənt/: important, noteworthy
- Consistent (adj.) /kənˈsɪstənt/: unchanging in nature, standard, or effect
- Dramatic (adj.) /drəˈmætɪk/: substantial, very noticeable
- Taper off (phrasal verb): to become gradually smaller or weaker
Grammar
- Comparative Structures: “Country A had higher access than Country B.”
- Superlative Forms: “Country A consistently had the highest levels.”
- Time Phrases: “By 2023,” “Over the 23-year period”
Conclusion
To summarize, tackling an IELTS Writing Task 1 question on comparing clean water access across countries involves analyzing data trends, constructing a clear essay structure, and using appropriate vocabulary and grammar. By following these guidelines and practicing regularly, you are much more likely to achieve a Band 7+ score.
Remember, the key to success is practice and understanding the task requirements thoroughly. Good luck!