The topic of comparing levels of access to education in different regions between 2000 and 2023 is a significant one and appears frequently in IELTS Writing Task 1. This task often necessitates the ability to interpret data accurately and to present your findings in a clear and concise manner. In this article, we will discuss how to approach this topic, provide tips on how to structure your essay, and offer a sample response to illustrate key points.
For this topic, you might find yourself encountering various types of data representation such as bar charts, line graphs, and tables. Three possible essay prompts based on this theme could be:
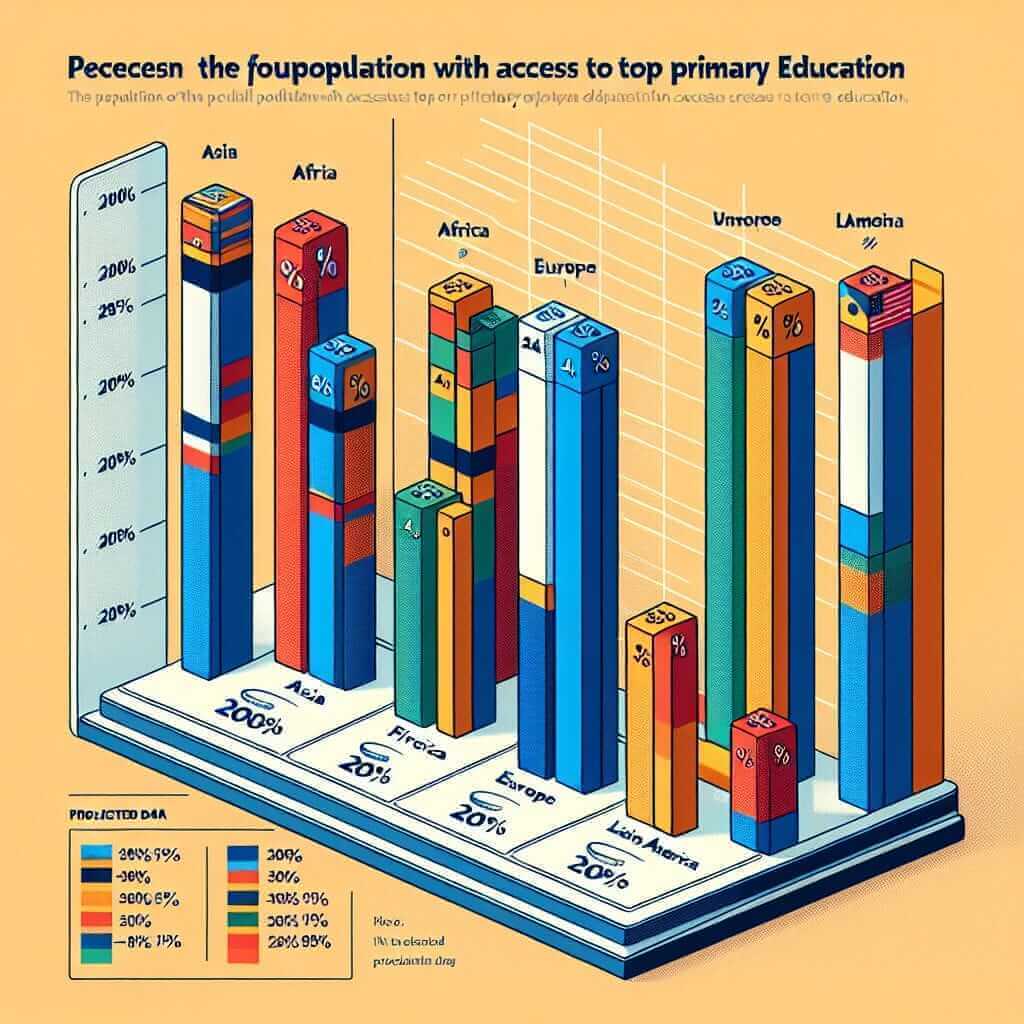
- The bar chart below shows the changes in the levels of access to primary education in different regions from 2000 to 2023.
- The line graph below compares the levels of tertiary education participation in three different regions over a period of 23 years.
- The table below illustrates the differences in enrollment rates in secondary education across various regions between 2000 and 2023.
Essay Prompt and Sample Writing Task
Let’s choose the first prompt for our detailed explanation:
Prompt: The bar chart below shows the changes in the levels of access to primary education in different regions from 2000 to 2023.
Data Analysis and Presentation
First, we’ll create our bar chart data. The regions will be Asia, Africa, Europe, and Latin America, and the years of comparison are 2000, 2010, and 2023.
| Region | 2000 | 2010 | 2023 |
|---|---|---|---|
| Asia | 50% | 70% | 90% |
| Africa | 30% | 50% | 60% |
| Europe | 95% | 97% | 99% |
| Latin America | 70% | 80% | 85% |

Breaking Down the Prompt
Understanding the Task
In this type of task, you are required to:
- Summarize the information by describing the main features and trends.
- Compare the data where relevant.
Planning Your Essay
- Introduction: Paraphrase the prompt and briefly mention what the chart shows.
- Overview: Summarize the main trends observed in the data.
- Body Paragraph 1: Describe specific details about the changes in access to education in two regions.
- Body Paragraph 2: Describe specific details about the changes in access to education in the remaining regions and make comparisons.
Sample Essay
Introduction
The bar chart illustrates the changes in the levels of access to primary education in Asia, Africa, Europe, and Latin America from 2000 to 2023.
Overview
Overall, there has been significant improvement in access to primary education across all regions over the 23-year period. Notably, Asia and Africa showed the most drastic increases, while Europe consistently maintained high levels of access.
Body Paragraph 1
In 2000, Asia had only 50% of its population with access to primary education. This percentage rose significantly to 70% in 2010 and further to 90% by 2023. Africa experienced a similar but less dramatic improvement. Access in this region increased from 30% in 2000 to 50% in 2010, reaching 60% by 2023.
Body Paragraph 2
Europe, on the other hand, started at a notably high level of 95% in 2000 and saw a modest increase to 97% in 2010. By 2023, nearly all children (99%) had access to primary education. Latin America’s rates were also relatively high and improved steadily from 70% in 2000 to 80% in 2010, and 85% in 2023. This data underscores the considerable efforts and progress made in enhancing educational access across these regions, with Asia and Africa making the most significant strides.
Word Count: 194
Key Tips for Writing
- Vocabulary: Utilize varied and precise vocabulary to describe increases and comparisons (e.g., “significant improvement”, “notably high level”).
- Grammar: Ensure proper use of tenses (past simple for past data, present perfect for trends progressing to the present).
- Coherence and Cohesion: Use linking words and phrases to connect your ideas (e.g., “Overall,”, “In 2000,”, “By 2023,”, “On the other hand,”, “This data underscores”).
Essential Vocabulary to Remember
- Drastic (adj.) /ˈdræstɪk: Extreme and sudden (Example: There was a drastic improvement in Asia’s education access.)
- Modest (adj.) /ˈmɑːdɪst: Not very large or great (Example: Europe saw a modest increase in access.)
- Underscore (v.) /ˌʌndərˈskɔːr: To emphasize or show the importance of something (Example: This data underscores the progress made.)
- Consistently (adv.) /kənˈsɪstəntli: Happening in the same way over time (Example: Europe consistently maintained high levels of access.)
- Steadily (adv.) /ˈstɛdɪli: Progressing or increasing at a consistent rate (Example: Latin America steadily improved their access rates.)
Conclusion
Approaching IELTS Writing Task 1 with a clear strategy will undoubtedly help achieve a higher band score. Focus on understanding the trends and comparing the data logically. With regular practice and by following these guidelines, a band score of 7 or above is within reach.