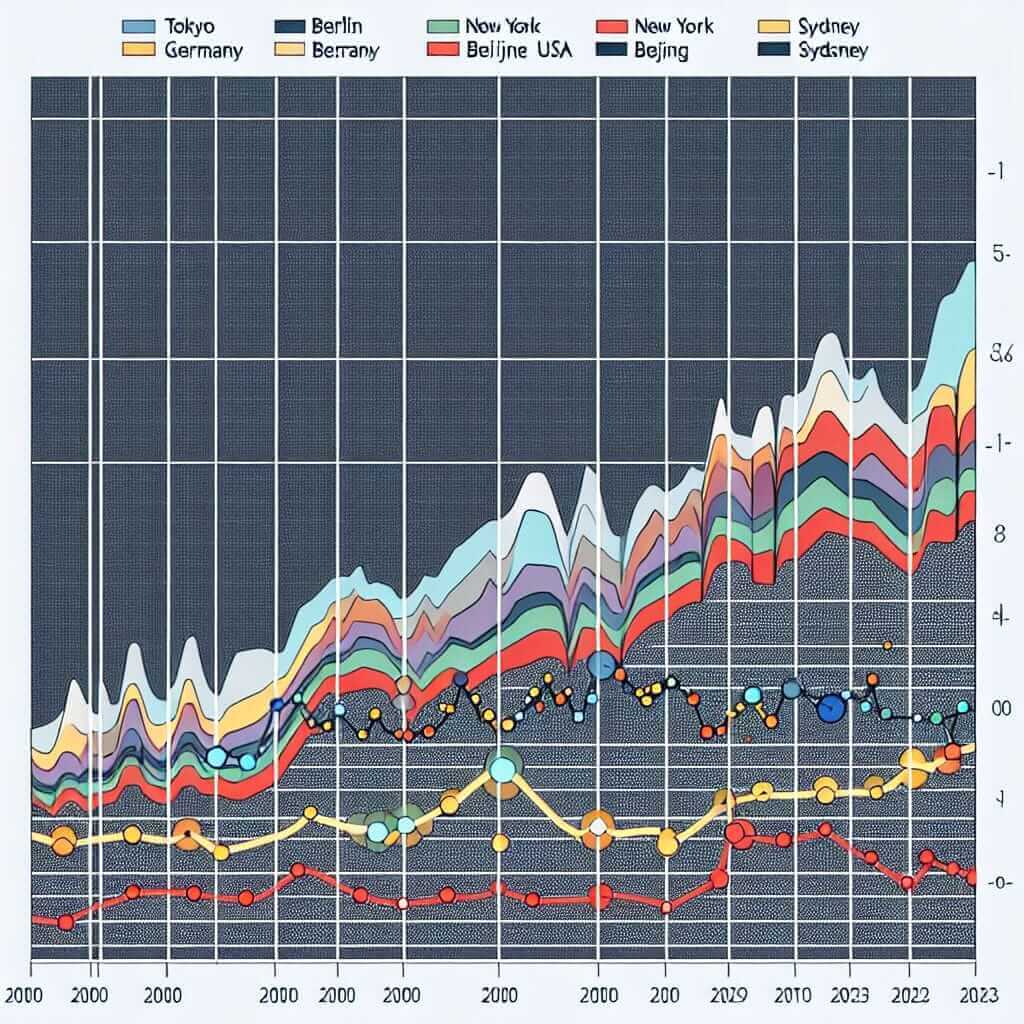
Understanding the trends in air quality across different cities over the years is a significant topic in today’s world, especially given the increased awareness of environmental issues. This topic frequently appears in IELTS Writing Task 1, where candidates are presented with various types of data, such as line graphs, bar charts, or tables, and are required to describe and compare the data accurately. In this lesson, we’ll delve deeply into this topic, examine typical tasks, and practice writing a response using real data.
Sample Task Introduction
This type of task usually involves presenting data on air quality levels in different cities across a given period. Here are three sample prompts inspired by real exam questions:
-
Sample Task 1: The graph below shows the air quality index (AQI) levels in five cities from 2000 to 2023. Summarize the information by selecting and reporting the main features and make comparisons where relevant.
-
Sample Task 2: The table below shows the levels of PM2.5 (particulate matter) in four urban areas from 2000 to 2023. Summarize the information by selecting and reporting the main features and make comparisons where relevant.
-
Sample Task 3: The charts below show the average levels of NO2 (Nitrogen Dioxide) in three cities during the years 2000, 2010, and 2023. Summarize the information by selecting and reporting the main features and make comparisons where relevant.
Selecting a Sample Task
For this lesson, we will use Sample Task 1 for detailed analysis and practice.
Sample Task 1: Data Representation
The graph below shows the air quality index (AQI) levels in five cities (Tokyo, Berlin, New York, Beijing, and Sydney) from 2000 to 2023.

Analyzing the Task
Before writing, it’s essential to analyze the task carefully:
-
Identify Key Components:
- The data spans over a period from 2000 to 2023.
- The main variables include the AQI levels and the cities involved.
-
Trends and Comparisons:
- Look for trends in the AQI levels over time.
- Identify any similarities or differences between the cities.
Sample Writing
Let’s write a task response following these insights.
Task Response
The line graph illustrates the changes in the air quality index (AQI) in five different cities—Tokyo, Berlin, New York, Beijing, and Sydney—from 2000 to 2023.
Overall, it is apparent that the AQI levels in these cities have fluctuated throughout the examined period. However, specific trends and patterns are observable in each city.
Tokyo and Berlin both showed a relatively stable trend in AQI levels, starting at around 50 in 2000 and maintaining similar figures throughout the years, with minor fluctuations. On the contrary, New York experienced a gradual decline in AQI levels from approximately 70 in 2000 to around 40 in 2023, indicating an improvement in air quality.
Beijing, however, demonstrated a contrasting pattern, with AQI levels peaking to just over 150 in 2010 before declining sharply to around 70 by 2023. This suggests that significant efforts might have been made to improve air quality in this city post-2010.
Lastly, Sydney exhibited a unique trend where AQI levels saw a moderate increase from 50 in 2000 to about 90 in 2015, followed by a notable decline to 40 by 2023.
In summary, while Tokyo and Berlin maintained stable AQI levels, New York showed a marked improvement. In contrast, Beijing and Sydney experienced more volatility, with Beijing showing significant improvements in the latter half of the period.
Word Count: 215
Key Points When Writing
- Task Achievement: Make sure your report covers all the essential features and makes relevant comparisons.
- Coherence and Cohesion: Organize your information logically and clearly, linking your ideas with appropriate cohesive devices.
- Lexical Resource: Utilize a range of vocabulary but avoid repetition. Use terms like “fluctuate,” “peak,” “decline,” and “pattern.”
- Grammatical Range and Accuracy: Use various sentence structures accurately, including complex sentences.
Important Vocabulary and Grammar
Vocabulary
- Fluctuate (verb) /ˈflʌk.tʃu.eɪt/: to rise and fall irregularly.
- Peak (verb/noun) /piːk/: to reach the highest point, high point.
- Decline (verb/noun) /dɪˈklaɪn/: to decrease; a decrease.
- Volatility (noun) /ˌvɔː.ləˈtɪl.ɪ.ti/: the quality of being subject to rapid and unpredictable changes.
- Improvement (noun) /ɪmˈpruːv.mənt/: a condition of getting better.
Grammar Focus
Consider using clauses to enhance your writing:
- Relative Clauses: “The levels, which fluctuated notably, indicated…”
- Time Clauses: “When examining the period from 2000 to 2023, it is clear that…”
- Passive Voice: “Efforts might have been made to improve air quality.”
Conclusion
When you approach a task like “Comparing Levels of Air Quality in Different Cities,” remember to focus on the main trends and comparisons, use appropriate vocabulary and grammar, and structure your response logically. Practice regularly and review sample responses for continual improvement.
By following these guidelines and practicing effectively, you can aim for a high band score in the IELTS Writing Task 1.